Report Generator 3.X For WHMCS
(→About Report Generator For WHMCS) |
|||
| Line 4: | Line 4: | ||
=About [http://www.modulesgarden.com/products/whmcs/report_generator/features Report Generator For WHMCS]= | =About [http://www.modulesgarden.com/products/whmcs/report_generator/features Report Generator For WHMCS]= | ||
{| | {| | ||
| − | |style="padding: 10px 0px 5px 0px;"|'''Report Generator For WHMCS | + | |style="padding: 10px 0px 5px 0px;"|'''Report Generator For WHMCS''' is a module that allows you to create custom reports using SQL query builder and display them in tables and graphs.<br /> |
| − | + | You can also generate report in XML or PDF and send it over email to specified staff members. | |
| − | You can also generate | + | |
|} | |} | ||
| − | *'''Features:''' | + | |
| + | *'''Admin Area Features:''' | ||
{| | {| | ||
| − | |style="padding: 10px 0px 0px 30px;"|✔ | + | |style="padding: 10px 0px 0px 30px;"|✔ Drag & Drop WYSIWYG Report Builder |
|} | |} | ||
{| | {| | ||
| − | |style="padding: 0px 0px 0px 30px;"|✔ | + | |style="padding: 0px 0px 0px 30px;"|✔ Dynamic Reports Editing |
| + | |} | ||
| + | {| | ||
| + | |style="padding: 0px 0px 0px 30px;"|✔ Report Types(Data Table, Pie Chart, Area Chart, Column Chart) | ||
|} | |} | ||
{| | {| | ||
| Line 19: | Line 22: | ||
|} | |} | ||
{| | {| | ||
| − | |style="padding: 0px 0px 0px 30px;"|✔ Multi Sections Of Dynamically Generated Reports | + | |style="padding: 0px 0px 0px 30px;"|✔ User Created Reports |
| + | |} | ||
| + | {| | ||
| + | |style="padding: 0px 0px 0px 30px;"|✔ Multi-Sections Of Dynamically Generated Reports | ||
|} | |} | ||
{| | {| | ||
|style="padding: 0px 0px 0px 30px;"|✔ Dynamic Filters | |style="padding: 0px 0px 0px 30px;"|✔ Dynamic Filters | ||
| + | |} | ||
| + | {| | ||
| + | |style="padding: 0px 0px 0px 30px;"|✔ Predefined SQL Expressions At The Report Builder | ||
| + | |} | ||
| + | {| | ||
| + | |style="padding: 0px 0px 0px 30px;"|✔ Multiple Joins At The Report Builder | ||
|} | |} | ||
{| | {| | ||
| Line 28: | Line 40: | ||
|} | |} | ||
{| | {| | ||
| − | |style="padding: 0px 0px 0px 30px;"|✔ Print Reports | + | |style="padding: 0px 0px 0px 30px;"|✔ Print Reports With Print Preview |
| + | |} | ||
| + | {| | ||
| + | |style="padding: 0px 0px 0px 30px;"|✔ Schedule Automatic Reports Sending To Chosen Staff Members With Specified Conditions | ||
| + | |} | ||
| + | {| | ||
| + | |style="padding: 0px 0px 0px 30px;"|✔ Export To CSV, XML and XML Structure | ||
| + | |} | ||
| + | {| | ||
| + | |style="padding: 0px 0px 0px 30px;"|✔ Export To CSV From Report View - Allows You To Set Up Undefault Value Of Filter | ||
| + | |} | ||
| + | {| | ||
| + | |style="padding: 0px 0px 0px 30px;"|✔ Import From The XML Structure | ||
| + | |} | ||
| + | {| | ||
| + | |style="padding: 0px 0px 0px 30px;"|✔ Generate PDF - Both Manually And By Cron Job | ||
|} | |} | ||
{| | {| | ||
| − | |style="padding: 0px 0px 0px 30px;"|✔ | + | |style="padding: 0px 0px 0px 30px;"|✔ Translation Of Database Columns And Tables From The Settings Tab |
|} | |} | ||
{| | {| | ||
| − | |style="padding: 0px 0px | + | |style="padding: 0px 0px 10px 30px;"|✔ Enable Unicode Font For Generated PDF |
|} | |} | ||
{| | {| | ||
| − | |||
|} | |} | ||
*'''Additionally:''' | *'''Additionally:''' | ||
| Line 44: | Line 70: | ||
|} | |} | ||
{| | {| | ||
| − | |style="padding: 0px 0px | + | |style="padding: 0px 0px 0px 30px;"|✔ Supports WHMCS V5 and Later |
| + | |} | ||
| + | {| | ||
| + | |style="padding: 0px 0px 0px 30px;"|✔ User-Friendly Interface | ||
| + | |} | ||
| + | {| | ||
| + | |style="padding: 0px 0px 10px 30px;"|✔ Migration Tool | ||
| + | |} | ||
| + | *'''User Created Reports:''' | ||
| + | {| | ||
| + | |style="padding: 10px 0px 0px 30px;"|✔ 1. Section 1: Orders Of Services In Selected Period (Column Chart) | ||
| + | |} | ||
| + | {| | ||
| + | |style="padding: 0px 0px 0px 30px;"|✔ 2. Section 1: Orders Of Services In Time (Column Chart) | ||
| + | |} | ||
| + | {| | ||
| + | |style="padding: 0px 0px 0px 30px;"|✔ 3. Section 1: Orders Over The Weekdays (Pie Chart) | ||
| + | |} | ||
| + | {| | ||
| + | |style="padding: 0px 0px 0px 30px;"|✔ 4. Section 1: Most Valuable Clients (Data Table) | ||
| + | |} | ||
| + | {| | ||
| + | |style="padding: 0px 0px 0px 30px;"|✔ 5. Section 1: User Accounts Created In Selected Period (Data Table) <br /> | ||
| + | Section 2: Amount Of User Accounts Created In Selected Period (Column Chart) | ||
| + | |} | ||
| + | {| | ||
| + | |style="padding: 0px 0px 0px 30px;"|✔ 6. Section 1: Tickets Replied By Admin (Data Table) <br /> | ||
| + | Section 2: Tickets Replied By Admin (Data Table)<br /> | ||
| + | Section 3: Tickets Replied By Admin (Pie Chart) | ||
| + | |} | ||
| + | {| | ||
| + | |style="padding: 0px 0px 10px 30px;"|✔ 7. Section 1: Customers Per Country (Pie Chart) | ||
| + | |} | ||
| + | *'''Predefined Reports:''' | ||
| + | {| | ||
| + | |style="padding: 10px 0px 0px 30px;"|✔ 1. Section 1: Open Tickets For The Period (Data Table)<br /> | ||
| + | Section 2: New Invoices For The Period (Data Table)<br /> | ||
| + | Section 3: Invoice Reminders For The Period (Data Table)<br /> | ||
| + | Section 4: Hosting Renewals (Data Table)<br /> | ||
| + | Section 5: Suspended Services For The Period (Data Table)<br /> | ||
| + | Section 6: Domain Renewals For The Period (Data Table) | ||
| + | |} | ||
| + | {| | ||
| + | |style="padding: 0px 0px 0px 30px;"|✔ 2. Section 1: Closed/Answered Status Tickets By The Staff Member (Data Table)<br /> | ||
| + | Section 2: Tickets Stats For The Staff Over Time (Area Chart)<br /> | ||
| + | Section 3: Closed To-Do List Tasks Owned By The Staff Member (Data Table)<br /> | ||
| + | Section 4: To-Do List Tasks Owned By The Staff Member Grouped By Status (Pie Chart)<br /> | ||
| + | Section 5: Orders Summary (Area Chart) | ||
| + | |} | ||
| + | {| | ||
| + | |style="padding: 0px 0px 30px 30px;"|✔ 3. Section 1: Opened Tickets Stats For This Staff Over Time (Area Chart)<br /> | ||
| + | Section 2: To-Do List Tasks Owned By The Staff Member Grouped By Status (Pie Chart)<br /> | ||
| + | Section 3: Closed To-Do List Tasks Owned By The Staff Member (Data Table) | ||
|} | |} | ||
| Line 56: | Line 134: | ||
|} | |} | ||
{| | {| | ||
| − | |style="padding: 0px 0px 20px 25px;"|[[File: | + | |style="padding: 0px 0px 20px 25px;"|[[File:RG_1.png]] |
|} | |} | ||
{| | {| | ||
| Line 63: | Line 141: | ||
|} | |} | ||
{| | {| | ||
| − | |style="padding: 0px 0px 20px 25px;"|[[File: | + | |style="padding: 0px 0px 20px 25px;"|[[File:RG_2.png]] |
| + | |} | ||
| + | {| | ||
| + | |style="padding: 0px 0px 15px 15px;"|'''3. Remove all files from '' 'templates_c' ''folder. | ||
|} | |} | ||
{| | {| | ||
| − | |style="padding: 0px 0px 15px 15px;"|''' | + | |style="padding: 0px 0px 15px 15px;"|'''4. When you install Report Generator for the first time you have to rename '' 'license_RENAME.php' '' file.'''<br /> |
File is located at '' 'modules/addons/reportgenerator/license_RENAME.php' '' . Rename it from '' 'license_RENAME.php' '' to '' 'license.php' '' . | File is located at '' 'modules/addons/reportgenerator/license_RENAME.php' '' . Rename it from '' 'license_RENAME.php' '' to '' 'license.php' '' . | ||
|} | |} | ||
{| | {| | ||
| − | |style="padding: 0px 0px 20px 25px;"|[[File: | + | |style="padding: 0px 0px 20px 25px;"|[[File:RG_3.png]] |
|} | |} | ||
{| | {| | ||
| − | |style="padding: 0px 0px 15px 15px;"|''' | + | |style="padding: 0px 0px 15px 15px;"|'''5. In order to configure your license key, you have to edit a previously renamed '' 'license.php' file.' '' '''<br /> |
Enter your license key between quotation marks as presented on the following screen. You can find your license key at your client area'' → 'My Products' ''. | Enter your license key between quotation marks as presented on the following screen. You can find your license key at your client area'' → 'My Products' ''. | ||
|} | |} | ||
{| | {| | ||
| − | |style="padding: 0px 0px 20px 25px;"|[[File: | + | |style="padding: 0px 0px 20px 25px;"|[[File:RG_4.png]] |
|} | |} | ||
{| | {| | ||
| − | |style="padding: 0px 0px 15px 15px;"|''' | + | |style="padding: 0px 0px 15px 15px;"|'''6. Now you have to set chmod '' '755' '' or '' '777' '' to all folders in '' 'storage' '' folder.'''<br /> |
| − | '' ' | + | '' 'storage' '' folder is located at '' 'your_whmcs/modules/addons/reportgenerator/' ''.<br /> |
| + | ''Note: If you set up chmods incorrectly, export report and generate PDF report functionalities will not work. '' | ||
|} | |} | ||
{| | {| | ||
| − | |style="padding: 0px 0px 20px 25px;"|[[File: | + | |style="padding: 0px 0px 20px 25px;"|[[File:RG_5.png]] |
|} | |} | ||
{| | {| | ||
| − | |style="padding: 0px 0px 15px 15px;"|''' | + | |style="padding: 0px 0px 15px 15px;"|'''7. Now you have to activate the module in your WHMCS system. '''<br /> |
Log in to your WHMCS admin area. Go to '' 'Setup' '' → '' 'Addon Modules' ''. Afterwards, find '' 'Report Generator' '' and press '' 'Activate' '' button. | Log in to your WHMCS admin area. Go to '' 'Setup' '' → '' 'Addon Modules' ''. Afterwards, find '' 'Report Generator' '' and press '' 'Activate' '' button. | ||
|} | |} | ||
{| | {| | ||
| − | |style="padding: 0px 0px 20px 25px;"|[[File: | + | |style="padding: 0px 0px 20px 25px;"|[[File:RG_6.png]] |
|} | |} | ||
{| | {| | ||
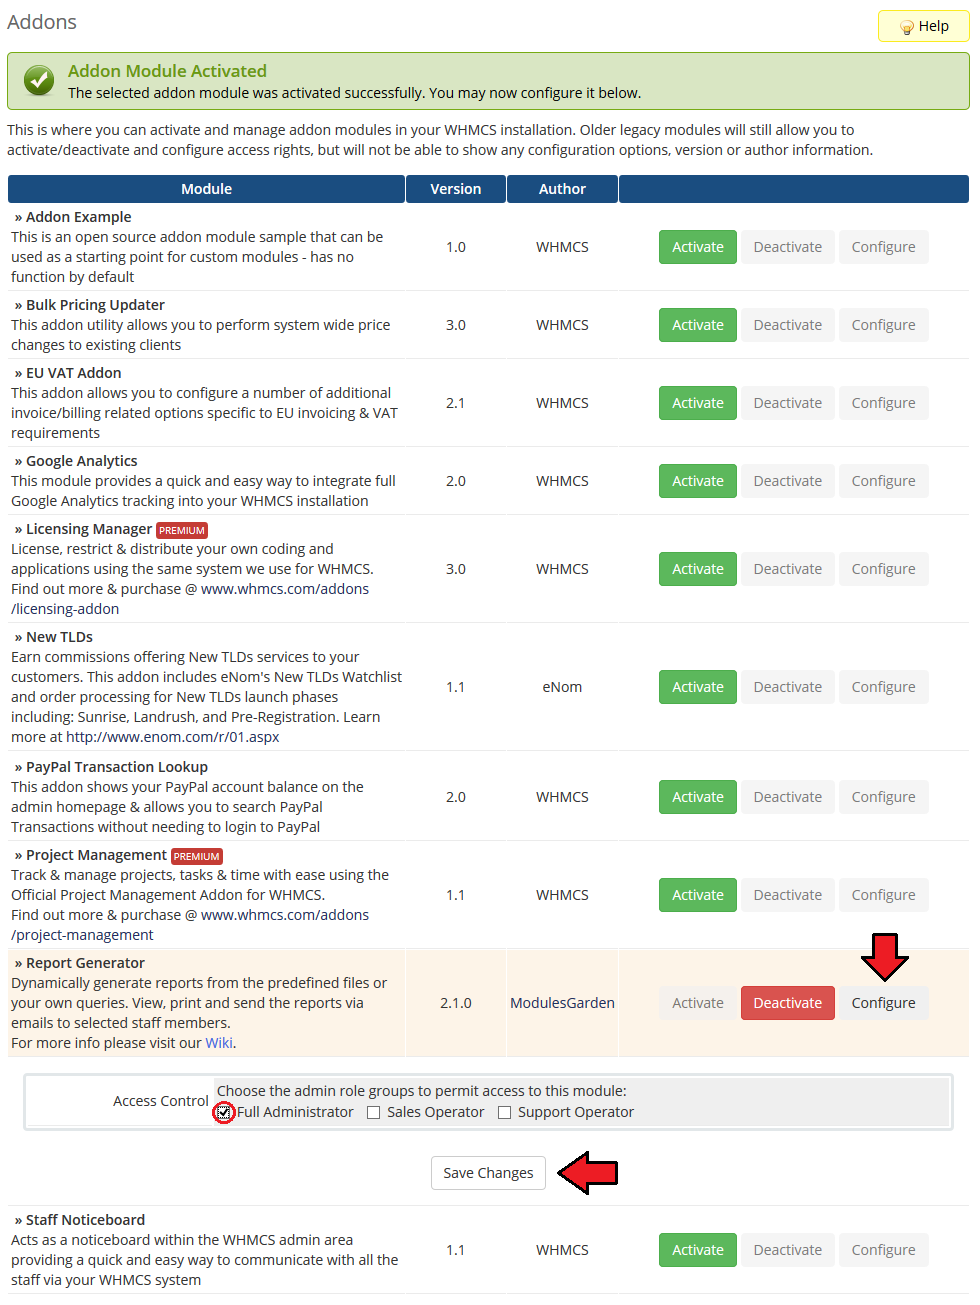
| − | |style="padding: 0px 0px 15px 15px;"|''' | + | |style="padding: 0px 0px 15px 15px;"|'''8. In the next step you need to permit access to this module.'''<br /> |
To do so, click on '' 'Configure' '' button, tick '' 'Full Administrator' '' and press '' 'Save Changes' ''. | To do so, click on '' 'Configure' '' button, tick '' 'Full Administrator' '' and press '' 'Save Changes' ''. | ||
|} | |} | ||
{| | {| | ||
| − | |style="padding: 0px 0px 20px 25px;"|[[File: | + | |style="padding: 0px 0px 20px 25px;"|[[File:RG_7.png]] |
|} | |} | ||
{| | {| | ||
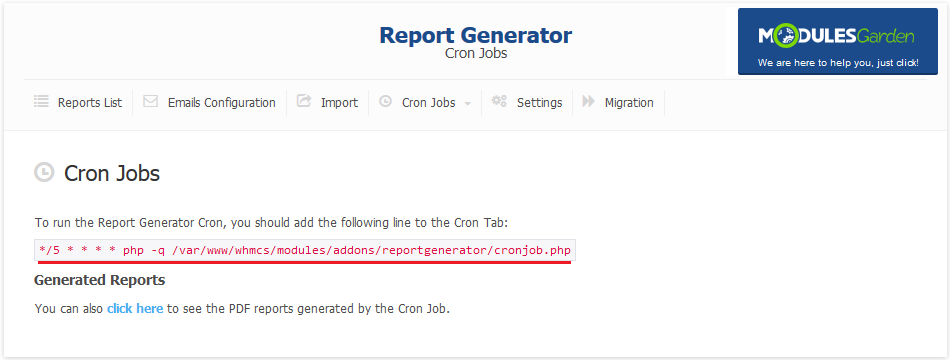
| − | |style="padding: 0px 0px 15px 15px;"|''' | + | |style="padding: 0px 0px 15px 15px;"|'''9. Last step is setting up cron jobs.'''<br /> |
| − | You can find them at your module '' 'Addons' '' → '' 'Report Generator' '' → '' 'Cron Jobs' ''. | + | You can find them at your module '' 'Addons' '' → '' 'Report Generator' '' → '' 'Cron Jobs' '' → '' 'Cron Setup' ''. |
|} | |} | ||
{| | {| | ||
| − | |style="padding: 0px 0px 20px 25px;"|[[File: | + | |style="padding: 0px 0px 20px 25px;"|[[File:RG_8.png]] |
|} | |} | ||
{| | {| | ||
| − | |style="padding: 0px 0px 15px 15px;"|''' | + | |style="padding: 0px 0px 15px 15px;"|'''10. You have just successfully installed Report Generator!'''<br /> |
You can access the module at '' 'Addons' '' → '' 'Report Generator' ''. | You can access the module at '' 'Addons' '' → '' 'Report Generator' ''. | ||
|} | |} | ||
{| | {| | ||
| − | |style="padding: 0px 0px 30px 25px;"|[[File: | + | |style="padding: 0px 0px 30px 25px;"|[[File:RG_9.png]] |
|} | |} | ||
=Configuration and Management= | =Configuration and Management= | ||
{| | {| | ||
| − | |style="padding: 10px 0px 30px 15px;"|'''Report Generator For WHMCS allows your to create custom reports using | + | |style="padding: 10px 0px 30px 15px;"|'''Report Generator For WHMCS allows your to create custom reports using drag & drop WYSIWYG builder.<br /> |
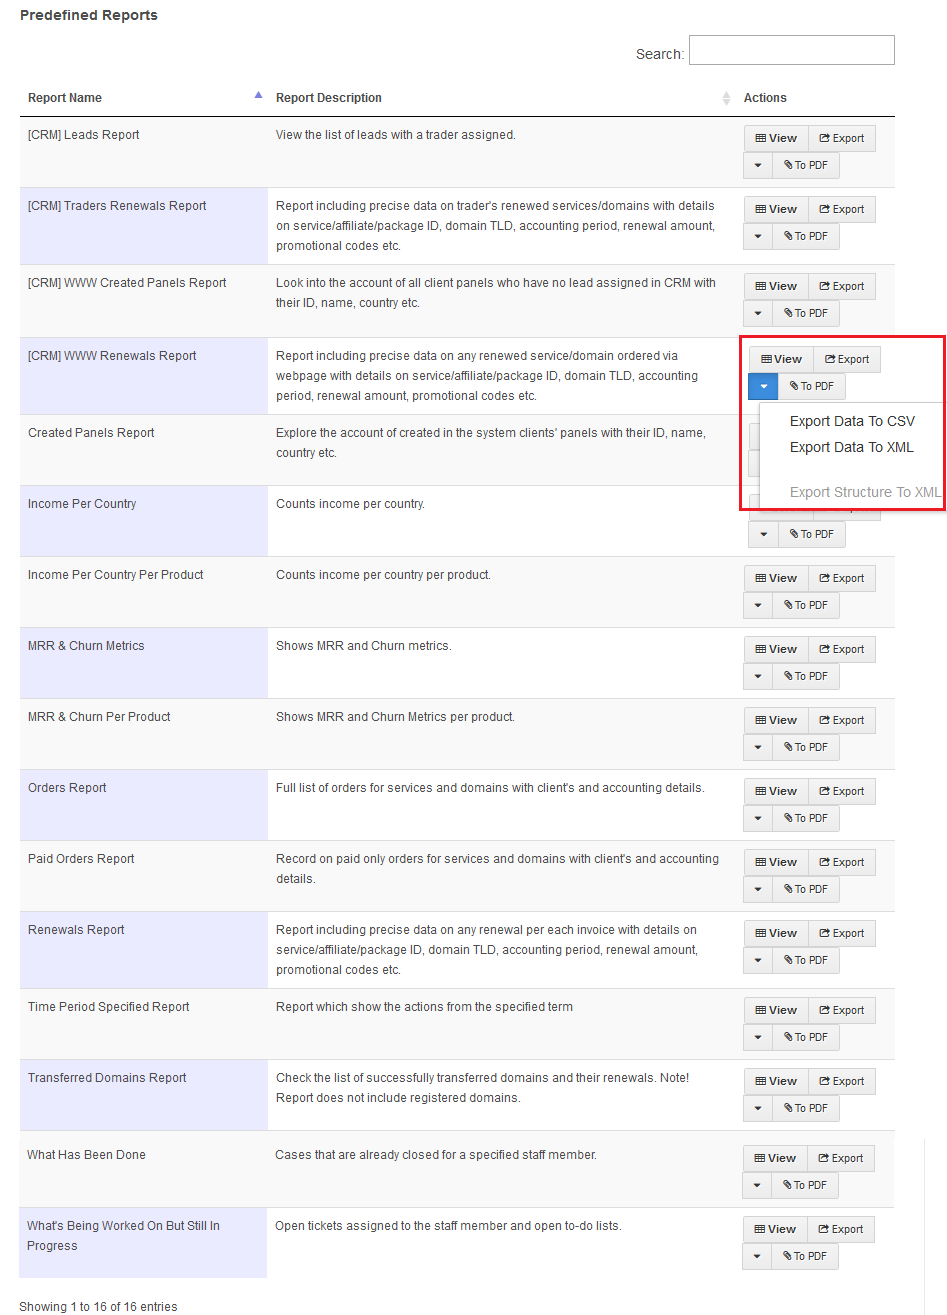
| − | Module | + | Module also offers additional useful features like predefined reports, import/export of reports, generating reports in PDF, ability to send then to admins and much more. |
|} | |} | ||
| − | == | + | ==Reports List== |
{| | {| | ||
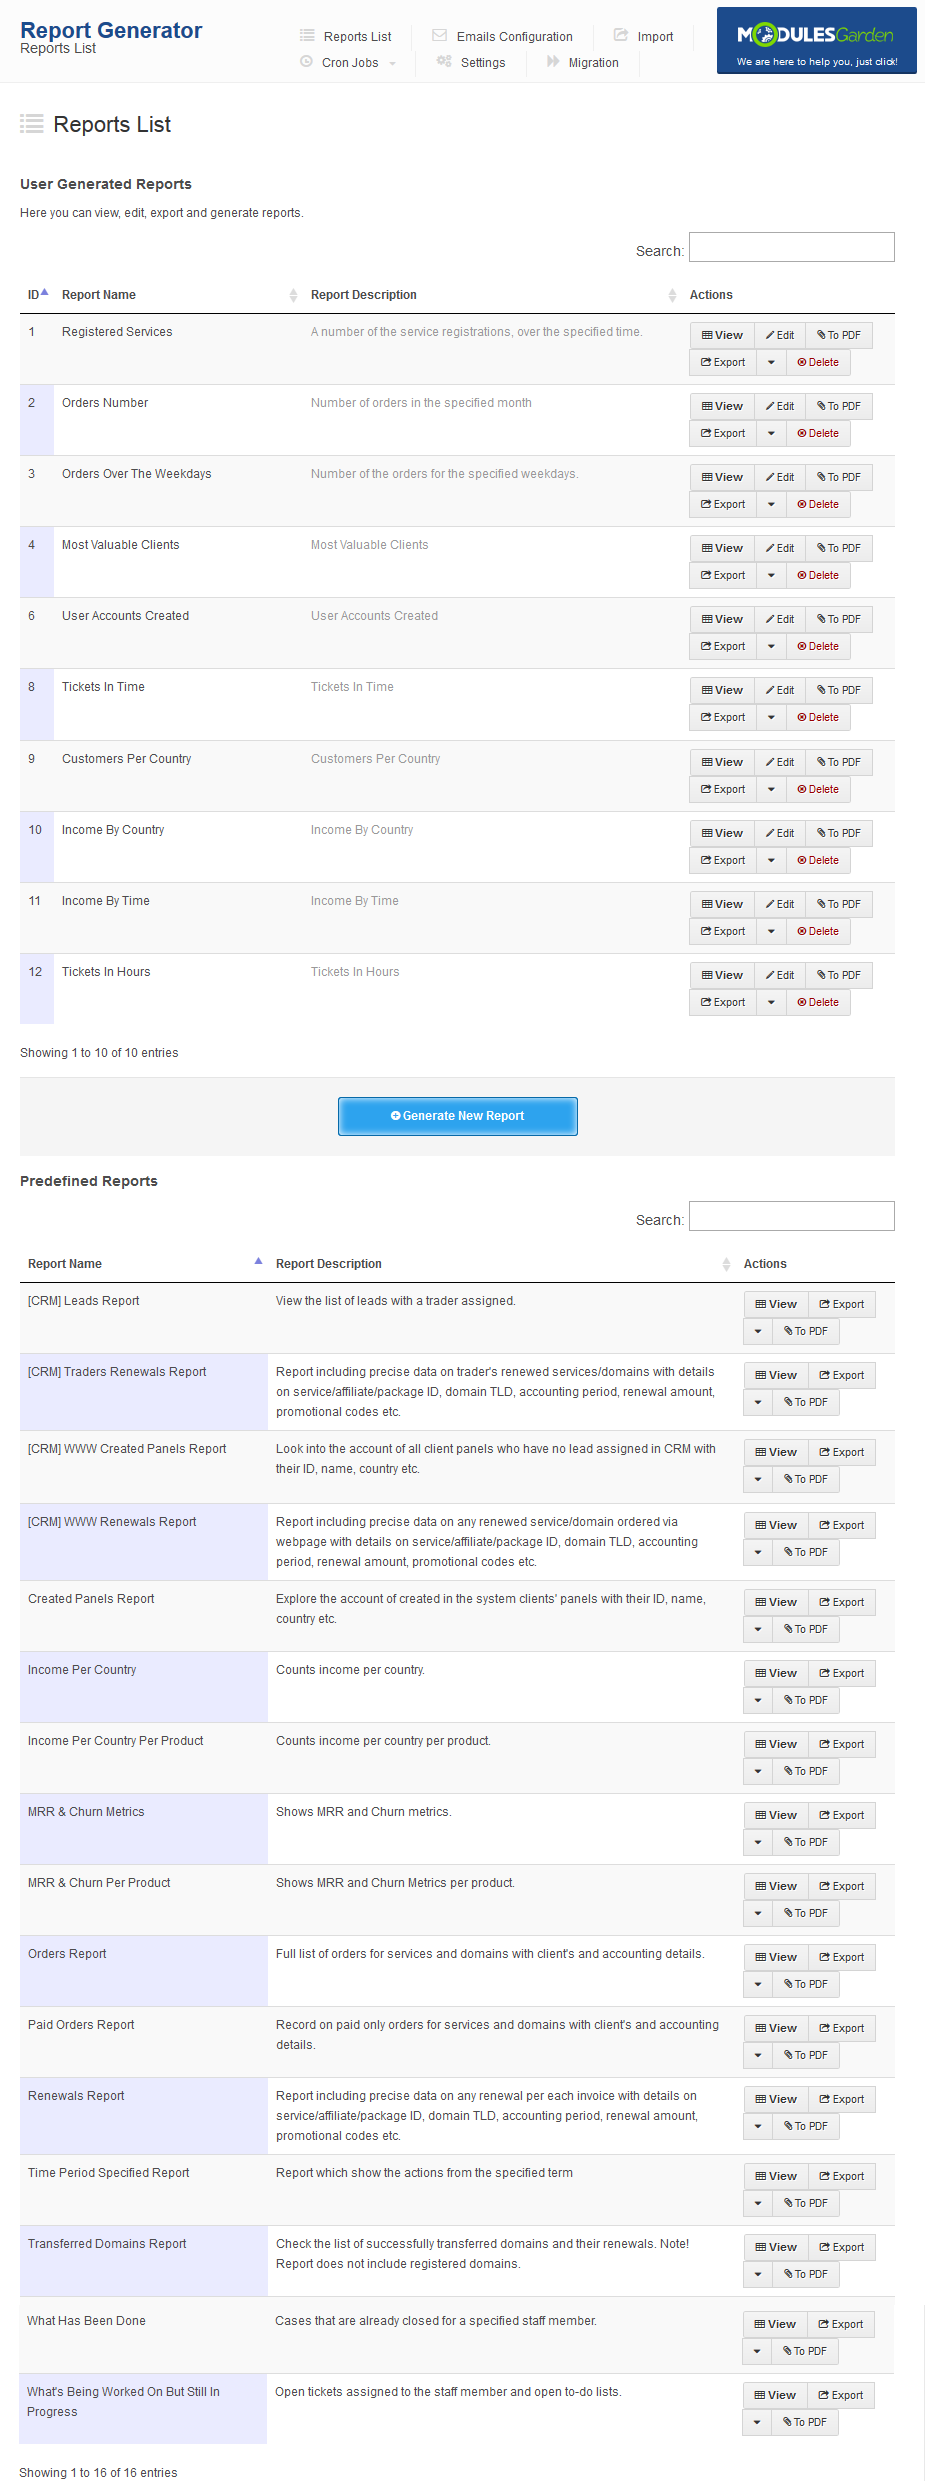
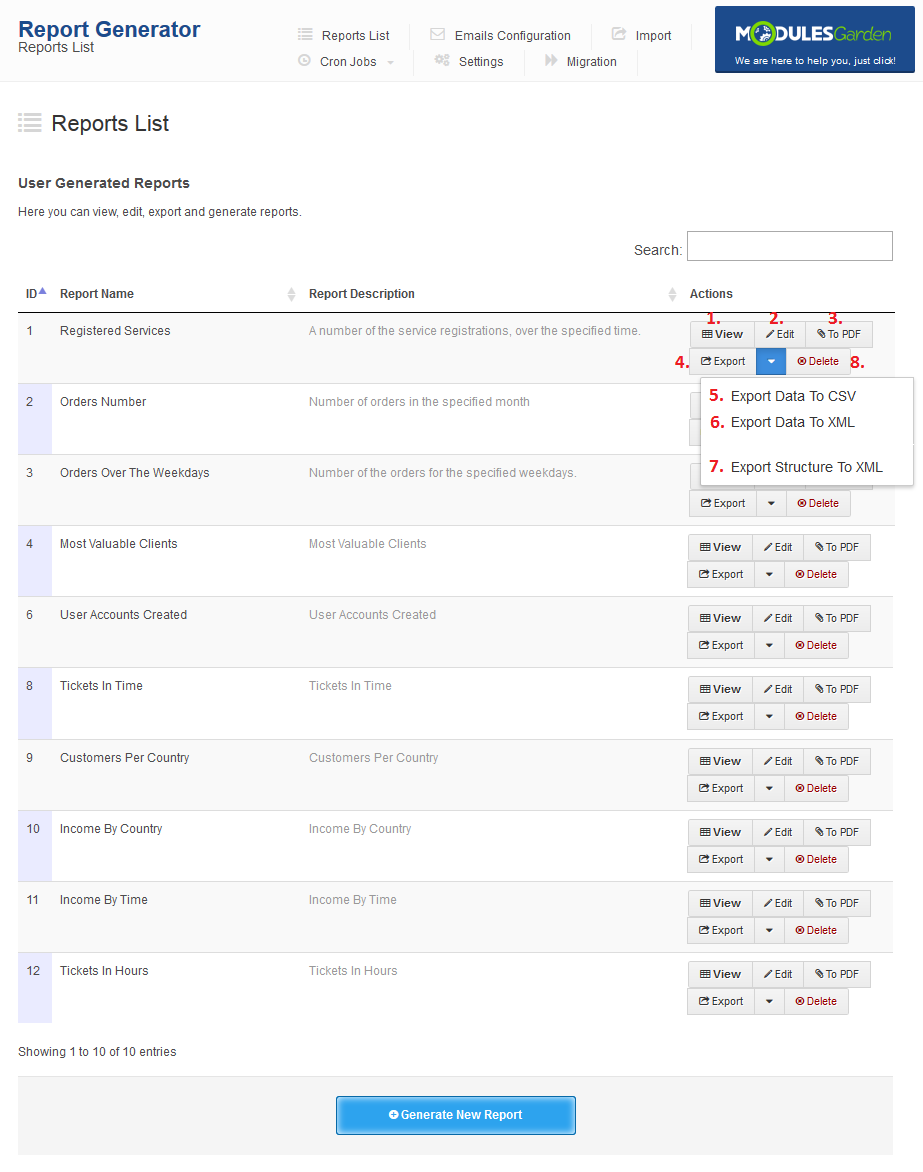
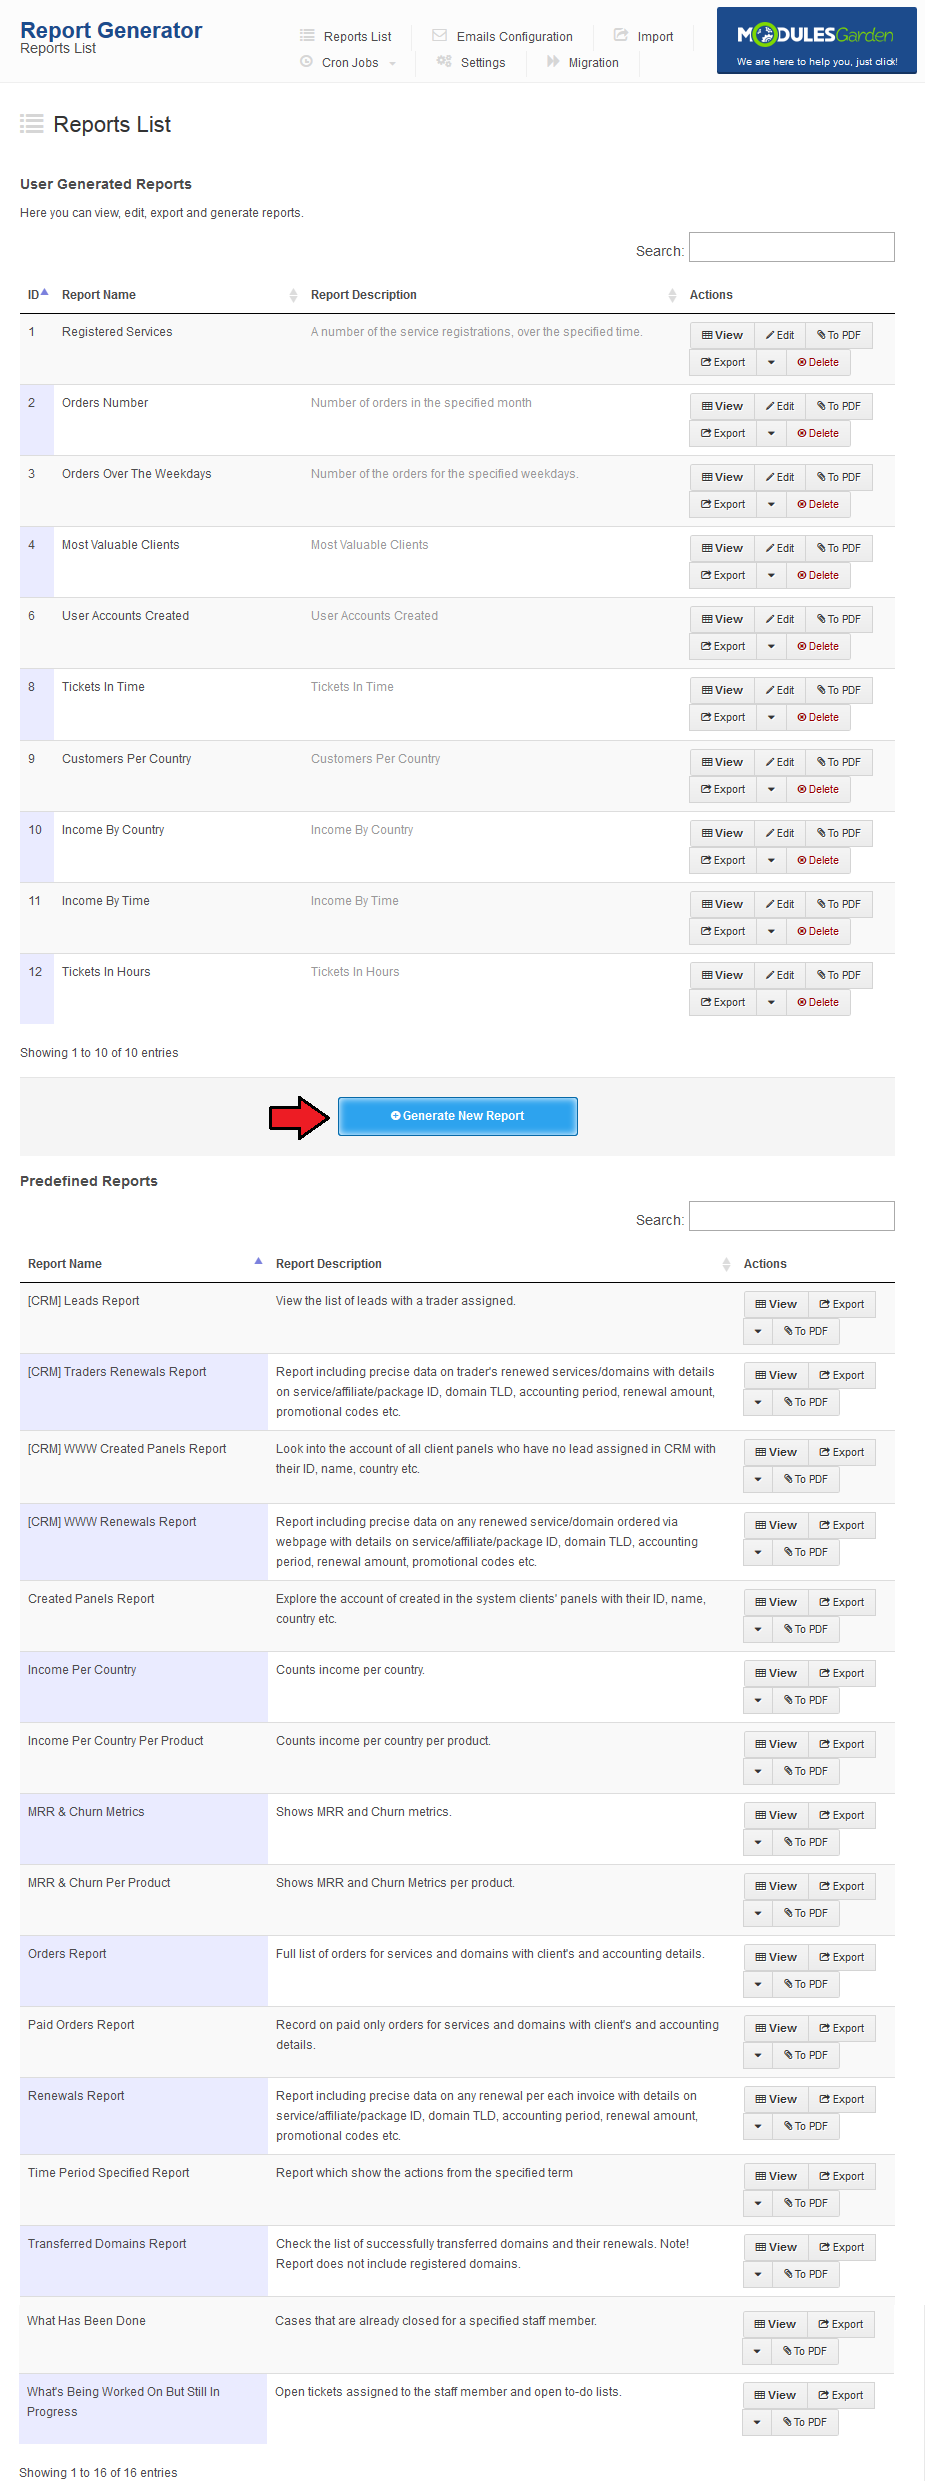
| − | |style="padding: 10px 0px 15px 15px;"|At '' ' | + | |style="padding: 10px 0px 15px 15px;"|At the '' 'Reports Lists' '' tab you can view all predefined reports as well as those created by you.<br /> |
| − | Here you can manage your reports by viewing (1), editing (2), | + | Here you can manage your reports by viewing (1), editing (2) and removing them (8).<br /> |
| + | Additionally, you can generate PDF version of reports (3) as well as export reports to CSV (4 & 5), XML (6) and XML structure (7). | ||
|} | |} | ||
{| | {| | ||
| − | |style="padding: 0px 0px 20px 25px;"|[[File: | + | |style="padding: 0px 0px 20px 25px;"|[[File:RG_10.png]] |
|} | |} | ||
{| | {| | ||
| − | |style="padding: 0px 0px 20px 15px;"|For predefined reports you can | + | |style="padding: 0px 0px 20px 15px;"|For predefined reports you can view report, generate PDF file and export report to CSV and XML. |
|} | |} | ||
{| | {| | ||
| − | |style="padding: 0px 0px 20px 25px;"|[[File: | + | |style="padding: 0px 0px 20px 25px;"|[[File:RG_11.png]] |
|} | |} | ||
{| | {| | ||
| − | |style="padding: 0px 0px 15px 15px;"|To | + | |style="padding: 0px 0px 15px 15px;"|To start creation of report press '' 'Create New Report' ''.<br /> |
| − | More information about creating new reports will be presented in the | + | More information about creating new reports will be presented in the [[#Creating_Report|'''Creating Report''']] section. |
|} | |} | ||
{| | {| | ||
| − | |style="padding: 0px 0px 30px 25px;"|[[File: | + | |style="padding: 0px 0px 30px 25px;"|[[File:RG_12.png]] |
|} | |} | ||
===Report View=== | ===Report View=== | ||
{| | {| | ||
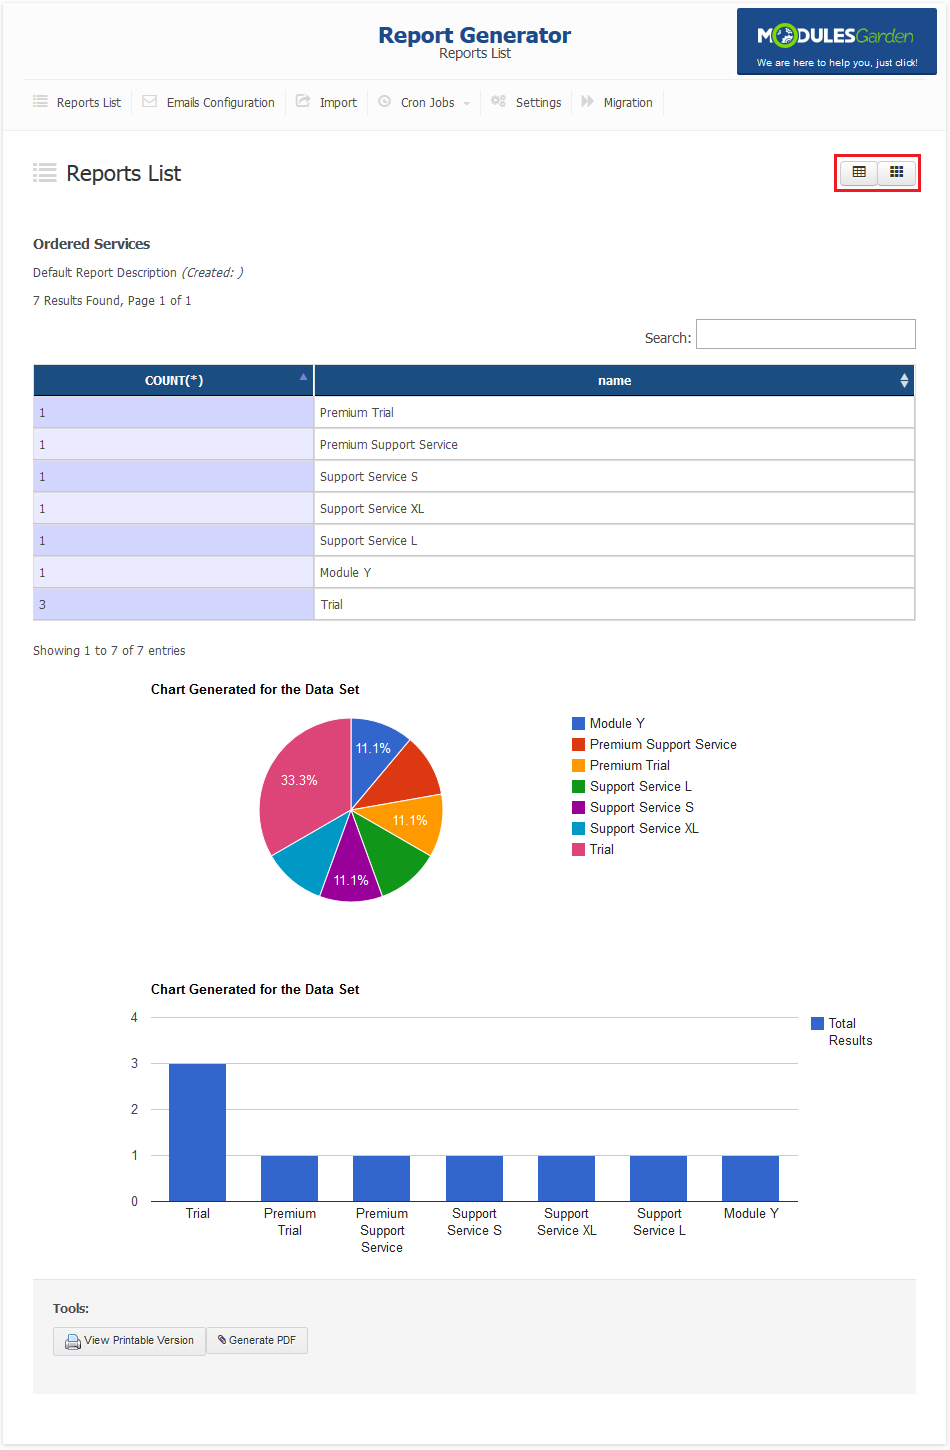
| − | |style="padding: 10px 0px 15px 15px;"|In report view you can see all tables and charts generated by the | + | |style="padding: 10px 0px 15px 15px;"|In the report view you can see all tables and charts generated by the report.<br /> |
You can display report in a simple or widget format. To switch between them press one of the buttons marked on the screen below. | You can display report in a simple or widget format. To switch between them press one of the buttons marked on the screen below. | ||
|} | |} | ||
{| | {| | ||
| − | |style="padding: 0px 0px 30px 25px;"|[[File: | + | |style="padding: 0px 0px 30px 25px;"|[[File:RG_13.png]] |
|} | |} | ||
===PDF Report View=== | ===PDF Report View=== | ||
{| | {| | ||
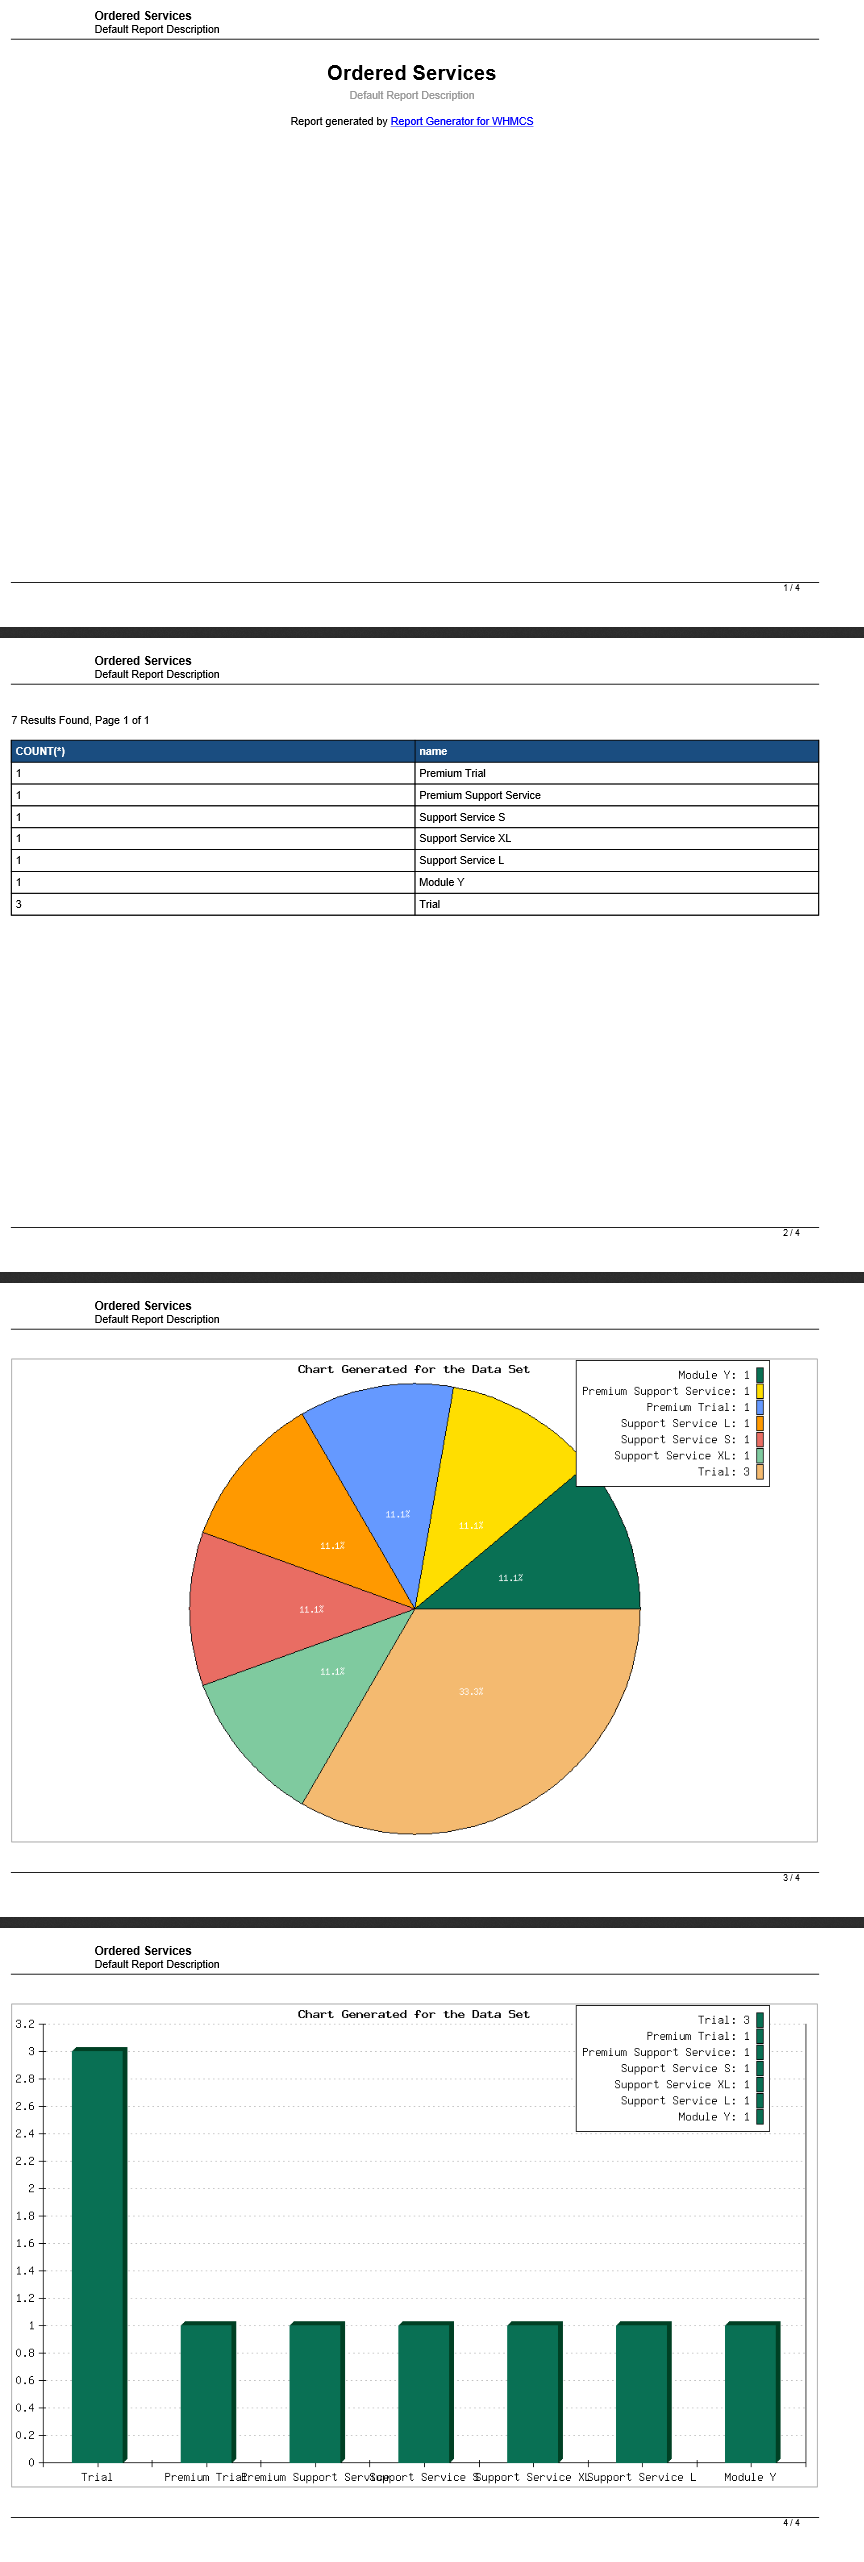
| − | |style="padding: 10px 0px 20px 15px;"|You can also view a PDF version of report which can be sent to | + | |style="padding: 10px 0px 20px 15px;"|You can also view a PDF version of report which can be sent to your staff memebers or saved to PDF file on your disk. |
|} | |} | ||
{| | {| | ||
| − | |style="padding: 0px 0px 30px 25px;"|[[File: | + | |style="padding: 0px 0px 30px 25px;"|[[File:RG_14.png]] |
|} | |} | ||
==Creating Report== | ==Creating Report== | ||
{| | {| | ||
| − | |style="padding: 10px 0px 15px 15px;"|At the beginning you have one section in your report. Each section generates one | + | |style="padding: 10px 0px 15px 15px;"|In this section we will show you how to prepare a few example reports.<br /> |
| − | + | If you wish to create your own report, we strongly recommend to firstly create reports shown below in order to get some practice.<br /> | |
| − | Below we will show you how to set up a single section.<br /> | + | First report will be quite simple and described step by step while the next ones will be more and more complex.<br /> |
| + | We will show you how specific options affect final report. | ||
| + | |} | ||
| + | ===First Report - User Accounts Created=== | ||
| + | {| | ||
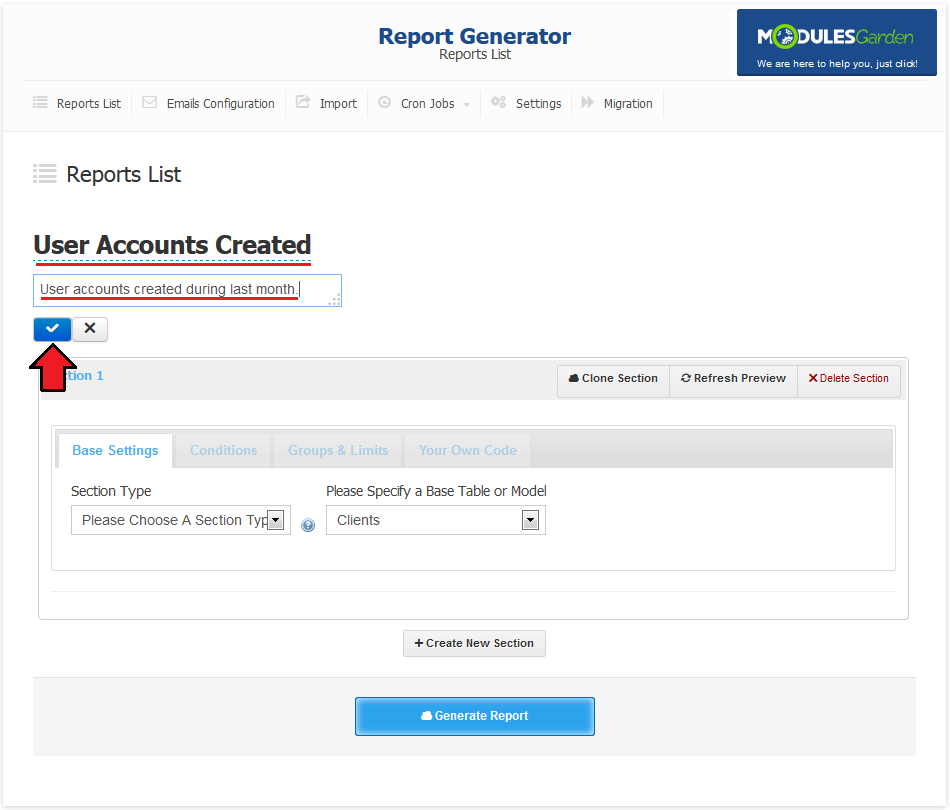
| + | |style="padding: 10px 0px 15px 15px;"|At the beginning you have only one section in your report. Each section generates one chart on final report.<br /> | ||
| + | In order to create additional chart on your report you need to add a new section.<br /> | ||
| + | Below we will show you how to set up a single section. This examplary report will show all new clients which accounts was created during last month.<br /> | ||
Start from entering report name and description. | Start from entering report name and description. | ||
|} | |} | ||
{| | {| | ||
| − | |style="padding: 0px 0px | + | |style="padding: 0px 0px 20px 25px;"|[[File:RG_15.png]] |
| + | |} | ||
| + | {| | ||
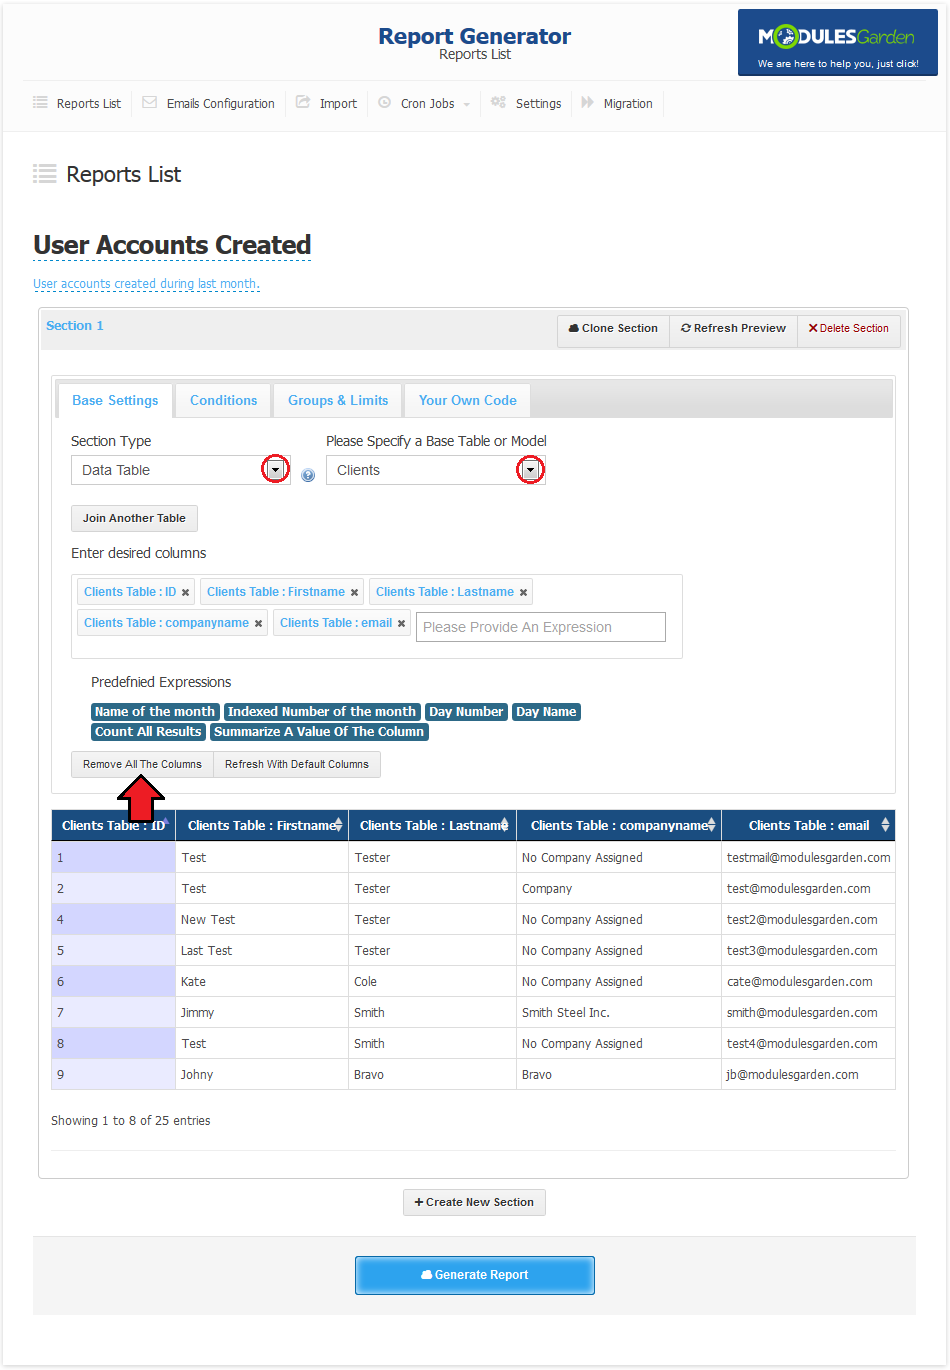
| + | |style="padding: 0px 0px 15px 15px;"|Now, select desired chart type and table you want to start with.<br /> | ||
| + | As you can see, default columns was loaded. For purpose of this report we will remove them through pressing '' 'Remove All The Columns' ''. | ||
| + | |} | ||
| + | {| | ||
| + | |style="padding: 0px 0px 20px 25px;"|[[File:RG_16.png]] | ||
| + | |} | ||
| + | {| | ||
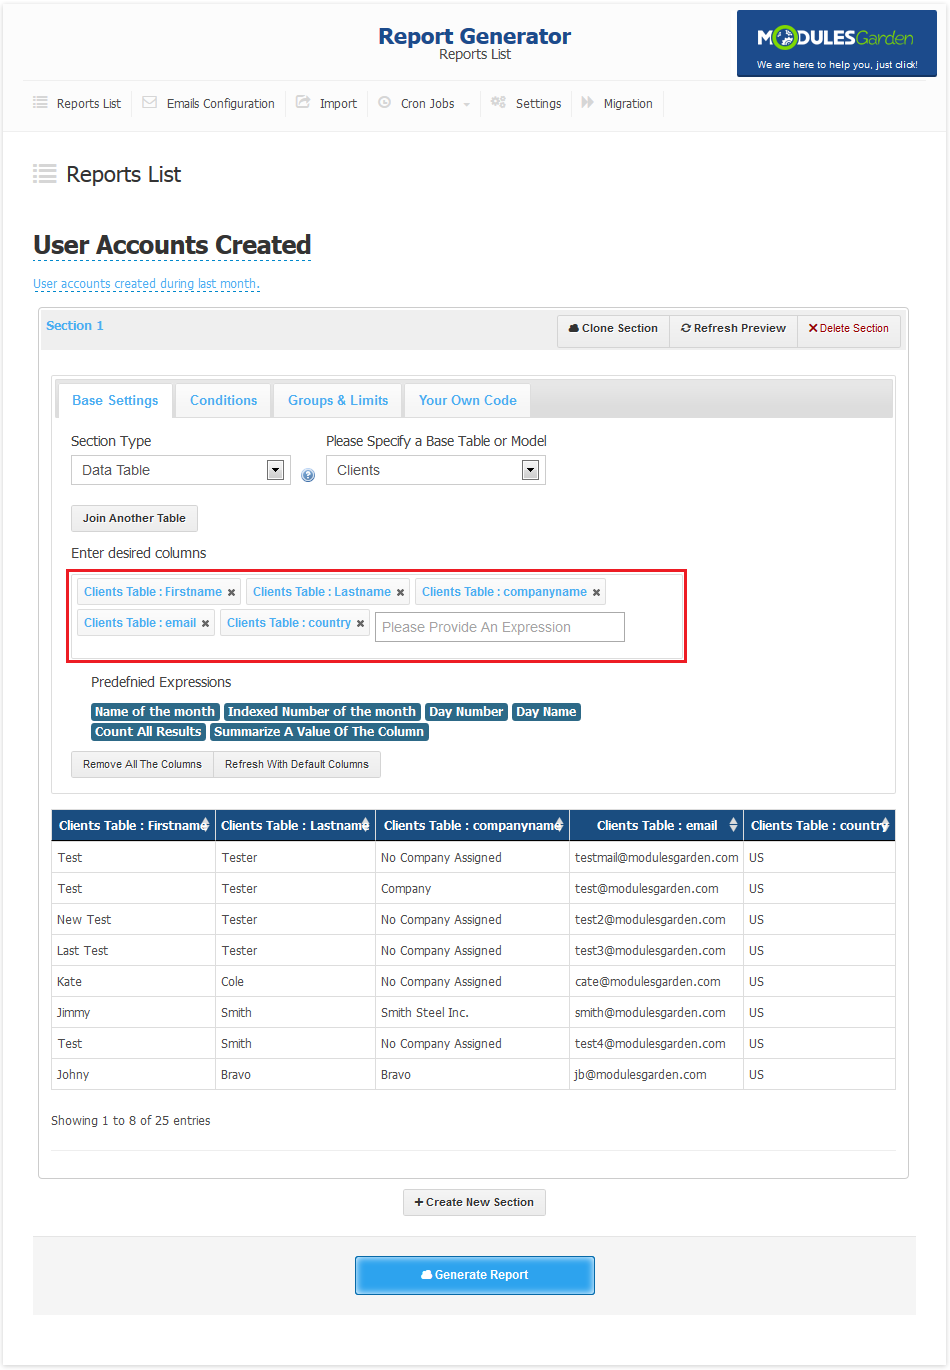
| + | |style="padding: 0px 0px 15px 15px;"|Adding columns to report is quite easy owing to autocomplete box.<br /> | ||
| + | Type table name and list of all available columns will show up. Now, select desired column. | ||
| + | |} | ||
| + | {| | ||
| + | |style="padding: 0px 0px 20px 25px;"|[[File:RG_17.png]] | ||
|} | |} | ||
| − | |||
{| | {| | ||
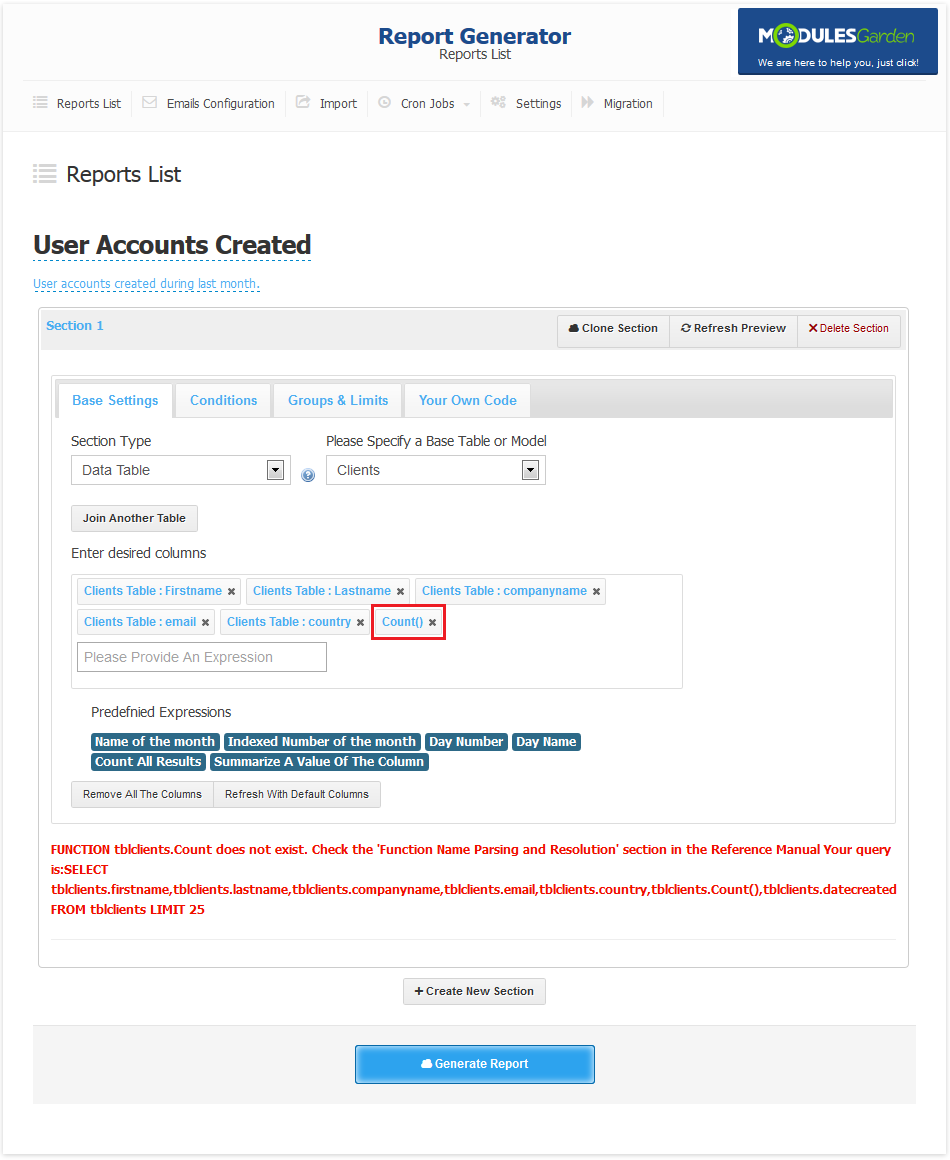
| − | |style="padding: | + | |style="padding: 0px 0px 15px 15px;"|As you may noticed earlier, each change made affects report preview displayed below.<br /> |
| − | + | In some situations preview may be replaced with error, which will contain information about lacking or miss-configured settings of report.<br /> | |
| − | + | On the following screen error message is caused by using incorrect function '' 'COUNT()' ''. | |
| + | |} | ||
| + | {| | ||
| + | |style="padding: 0px 0px 20px 25px;"|[[File:RG_18.png]] | ||
| + | |} | ||
| + | {| | ||
| + | |style="padding: 0px 0px 20px 15px;"|To set up time period for report, go to the '' 'Conditions' '' tab and mark '' 'Filter results by date' ''. | ||
| + | |} | ||
| + | {| | ||
| + | |style="padding: 0px 0px 20px 25px;"|[[File:RG_19.png]] | ||
| + | |} | ||
| + | {| | ||
| + | |style="padding: 0px 0px 15px 15px;"|Afterwards, select '' 'Clients Table : datecreated' '' and '' 'Monthly' '' from marked dropdown menus.<br /> | ||
| + | Now, report will be generated using only accounts created during last 30 days.<br /> | ||
| + | ''Note: Time period for report can be changed later at the report view or email configuration.'' | ||
| + | |} | ||
| + | {| | ||
| + | |style="padding: 0px 0px 20px 25px;"|[[File:RG_20.png]] | ||
| + | |} | ||
| + | {| | ||
| + | |style="padding: 0px 0px 15px 15px;"|You can set up ordering records by specific column. To do that, go to the '' 'Groups & Limits' '' tab.<br /> | ||
| + | We will order records by client last name. Choose '' 'Clients Table : lastname' '' and '' 'Ascending' '' as shown on the following screen.<br /> | ||
| + | Your report displaying all new accounts created during last month is ready, press '' 'Generate Report' '' to save it. | ||
| + | |} | ||
| + | {| | ||
| + | |style="padding: 0px 0px 20px 25px;"|[[File:RG_21.png]] | ||
| + | |} | ||
| + | {| | ||
| + | |style="padding: 0px 0px 15px 15px;"|Let's view that report through pressing '' 'View' '' button.<br /> | ||
| + | As you can see, column names are names of table columns.<br /> | ||
| + | Our module allows you to easily change column names under which table columns will be displayed.<br /> | ||
| + | You will find more information about setting up custom column names at [[#Tables_And_Columns_Definitions|'''Tables And Columns Definitions''']] section.<br /> | ||
| + | While viewing report with enabled filtering by date you can easily change time periods as shown on the following screen. | ||
| + | |} | ||
| + | {| | ||
| + | |style="padding: 0px 0px 30px 25px;"|[[File:RG_22.png]] | ||
| + | |} | ||
| + | |||
| + | ===Second Report - Orders Per User=== | ||
| + | {| | ||
| + | |style="padding: 10px 0px 15px 15px;"|This report will be counting orders made by clients this year. Due to that, we will need to use group by command to count those products.<br /> | ||
| + | As previously, start of defining report name and description. Additionally, choose report type and starting table. | ||
| + | |} | ||
| + | {| | ||
| + | |style="padding: 0px 0px 20px 25px;"|[[File:RG_23.png]] | ||
| + | |} | ||
| + | {| | ||
| + | |style="padding: 0px 0px 15px 15px;"|Join orders table to clients table. We will need it to display columns from both tables here.<br /> | ||
| + | Press '' 'Join Another Table' '' to proceed. | ||
| + | |} | ||
| + | {| | ||
| + | |style="padding: 0px 0px 20px 25px;"|[[File:RG_24.png]] | ||
| + | |} | ||
| + | {| | ||
| + | |style="padding: 0px 0px 15px 15px;"|It is time to think about how we want to connect these two tables.<br /> | ||
| + | We want to display client even if he has no order, therefore from '' 'Please Specify A Join Type' '' we will choose:<br /> | ||
| + | '' 'Return all rows from the left table, even if there are no match at the right table' ''. | ||
| + | |} | ||
| + | {| | ||
| + | |style="padding: 0px 0px 20px 25px;"|[[File:RG_25.png]] | ||
| + | |} | ||
| + | {| | ||
| + | |style="padding: 0px 0px 15px 15px;"|Now select two tables to join. For purpose of this report it will be tables '' 'Clients' '' and '' 'Orders' ''.<br /> | ||
| + | It is time to decide what columns will be used to join chosen columns.<br /> | ||
| + | At the table '' 'Orders' '' we can find column '' 'userid' '' in which there is stored ID of client who made an order.<br /> | ||
| + | Therefore we will join them using '' 'Clients Table : ID' '' and '' 'Orders Table : userid' ''.<br /> | ||
| + | At the end press '' 'Confirm!' ''. | ||
| + | |} | ||
| + | {| | ||
| + | |style="padding: 0px 0px 20px 25px;"|[[File:RG_26.png]] | ||
| + | |} | ||
| + | {| | ||
| + | |style="padding: 0px 0px 15px 15px;"|We want to display clients details in one column and quantity of orders in another one.<br /> | ||
| + | First column will be displayed by: | ||
| + | concat(tblclients.id, '# ', tblclients.firstname, ' ', tblclients.lastname) as Client | ||
| + | Concat will join provided columns while '' 'Client' '' is alias for this column. Alias will be used for generated report. | ||
| + | COUNT(*) as Orders | ||
| + | Count along with grouping by allow us to count records for each client. | ||
| + | Orders Table : ID as Any_Order_Exist | ||
| + | This column was added to handle clients which does not have any orders.<br /> | ||
| + | Due to join type, '' 'COUNT(*) as Orders' '' will be filled with 1 for them.<br /> | ||
| + | Proceed to the '' 'Groups & Limits' '' tab to set up grouping by (currently our generator does not recognize what should be counted). | ||
|} | |} | ||
{| | {| | ||
| − | |style="padding: 0px 0px 20px 25px;"|[[File: | + | |style="padding: 0px 0px 20px 25px;"|[[File:RG_27.png]] |
|} | |} | ||
{| | {| | ||
| − | |style="padding: 0px 0px | + | |style="padding: 0px 0px 15px 15px;"|We want to group records by clients, therefore fill '' 'Group This Section By' '' with '' 'Clients Table : ID' '' which is unique key at the client table.<br /> |
| + | Additionally, let's set up sorting clients by quantity of orders, we can use column alias for this.<br /> | ||
| + | As we predicted, clients with 0 orders have assigned 1 order. Proceed to '' 'Your Own Code' '' to fix that. | ||
|} | |} | ||
{| | {| | ||
| − | |style="padding: 0px 0px 20px 25px;"|[[File: | + | |style="padding: 0px 0px 20px 25px;"|[[File:RG_28.png]] |
|} | |} | ||
{| | {| | ||
| − | |style="padding: 0px 0px 15px 15px;"|At '' ' | + | |style="padding: 0px 0px 15px 15px;"|At '' 'Your Own Code' '' tab you can modify received output.<br /> |
| + | Code have to be placed in delimiters as shown below. | ||
<?php | <?php | ||
// your custom code here | // your custom code here | ||
| − | |||
?> | ?> | ||
The '' '$result' '' variable is passed by reference and contains just iterated element of the result array.<br /> | The '' '$result' '' variable is passed by reference and contains just iterated element of the result array.<br /> | ||
In this way you can create new columns in your table or modify existing ones through modifying this variable.<br /> | In this way you can create new columns in your table or modify existing ones through modifying this variable.<br /> | ||
| − | You can access it as | + | You can access it as typical array where the key is a column name and value is a current row value.<br /> |
| − | ''Important: <span style="color:#FF0000">Use this field with caution</span>, because every mistake made here can result with <span style="color:#FF0000">error in your production environment</span>.'' | + | '''Important 1: <span style="color:#FF0000">Use this field with caution</span>, because every mistake made here can result with <span style="color:#FF0000">error in your production environment</span>.'''<br /> |
| + | ''Note: While working on $result you can use aliases!''<br /> | ||
| + | What we need to do is assigning 0 to '' 'Orders' '' column if '' 'Any_Order_Exist' '' column is empty.<br /> | ||
| + | Additionally, we are unable to remove previously added column, therefore we will display '' 'Yes/No' '' in '' 'Any_Order_Exist' '' depending on existence of any order assigned to client.<br /> | ||
| + | Code placed below will do it for you: | ||
| + | <?php | ||
| + | foreach($result as $element) // iterate over all records storing current row in $element variable | ||
| + | { | ||
| + | if($element->Any_Order_Exist=="") // check if Any_Order_Exist is empty | ||
| + | { | ||
| + | $element->Orders=0; //assign 0 to Orders if Any_Order_Exist is empty | ||
| + | $element->Any_Order_Exist='No'; //assign 'No' to Any_Order_Exist if it is empty | ||
| + | } | ||
| + | else // if previous if was false, commands stored here will be ordered | ||
| + | { | ||
| + | $element->Any_Order_Exist='Yes'; //assign 'Yes' to Any_Order_Exist | ||
| + | } | ||
| + | } | ||
| + | ?> | ||
|} | |} | ||
{| | {| | ||
| − | |style="padding: 0px 0px 20px 25px;"|[[File: | + | |style="padding: 0px 0px 20px 25px;"|[[File:RG_29.png]] |
|} | |} | ||
{| | {| | ||
| − | |style="padding: 0px 0px | + | |style="padding: 0px 0px 20px 15px;"|Your code is ready, press '' 'Generate Report' '' to save it. |
| − | + | ||
| − | + | ||
|} | |} | ||
{| | {| | ||
| − | |style="padding: 0px 0px 30px 25px;"|[[File: | + | |style="padding: 0px 0px 30px 25px;"|[[File:RG_30.png]] |
|} | |} | ||
| − | === | + | ===Third Report - Unpaid Invoices=== |
{| | {| | ||
| − | |style="padding: 10px 0px 15px 15px;"|At | + | |style="padding: 10px 0px 15px 15px;"|At the third report we will show you how to prepare report displaying clients with the most unpaid invoices.<br /> |
| − | + | We will also add second section displaying unpaid invoices which can be filtered by client first and last name.<br /> | |
| + | Start of defining report name and description, choose report type and starting table.<br /> | ||
| + | Press '' 'Join Another Table' '' to proceed. | ||
|} | |} | ||
{| | {| | ||
| − | |style="padding: 0px 0px 20px 25px;"|[[File: | + | |style="padding: 0px 0px 20px 25px;"|[[File:RG_31.png]] |
|} | |} | ||
{| | {| | ||
| − | |style="padding: 0px 0px 20px 15px;"| | + | |style="padding: 0px 0px 20px 15px;"|Now, join invoice table using '' 'Clients Table : ID' '' and '' 'Invoices Table : userid' '' and set it up to return tables only if there is a match in the invoice table. |
|} | |} | ||
{| | {| | ||
| − | |style="padding: 0px 0px | + | |style="padding: 0px 0px 20px 25px;"|[[File:RG_32.png]] |
|} | |} | ||
| + | {| | ||
| + | |style="padding: 0px 0px 20px 15px;"|Add '' 'COUNT(*) as Sum' '' column and proceed to the '' 'Conditions' '' tab. | ||
| − | + | |} | |
{| | {| | ||
| − | |style="padding: | + | |style="padding: 0px 0px 20px 25px;"|[[File:RG_33.png]] |
| − | + | ||
| − | + | ||
|} | |} | ||
{| | {| | ||
| − | |style="padding: 0px 0px 20px | + | |style="padding: 0px 0px 20px 15px;"|Press '' 'Create New Filter' '' button to define new condition for your report. |
|} | |} | ||
{| | {| | ||
| − | |style="padding: 0px 0px | + | |style="padding: 0px 0px 20px 25px;"|[[File:RG_34.png]] |
| − | + | ||
|} | |} | ||
{| | {| | ||
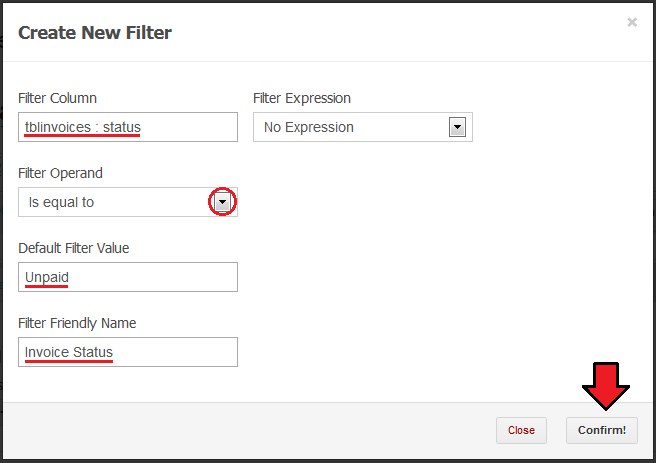
| − | |style="padding: 0px 0px | + | |style="padding: 0px 0px 15px 15px;"|Select column you want to define condition for, select filter operand, define default value of filter and filter friendly name.<br /> |
| + | Conditions can be changed at the report view, they will be displayed under friendly name defined here. | ||
|} | |} | ||
{| | {| | ||
| − | |style="padding: 0px 0px | + | |style="padding: 0px 0px 20px 25px;"|[[File:RG_35.png]] |
| − | + | ||
|} | |} | ||
{| | {| | ||
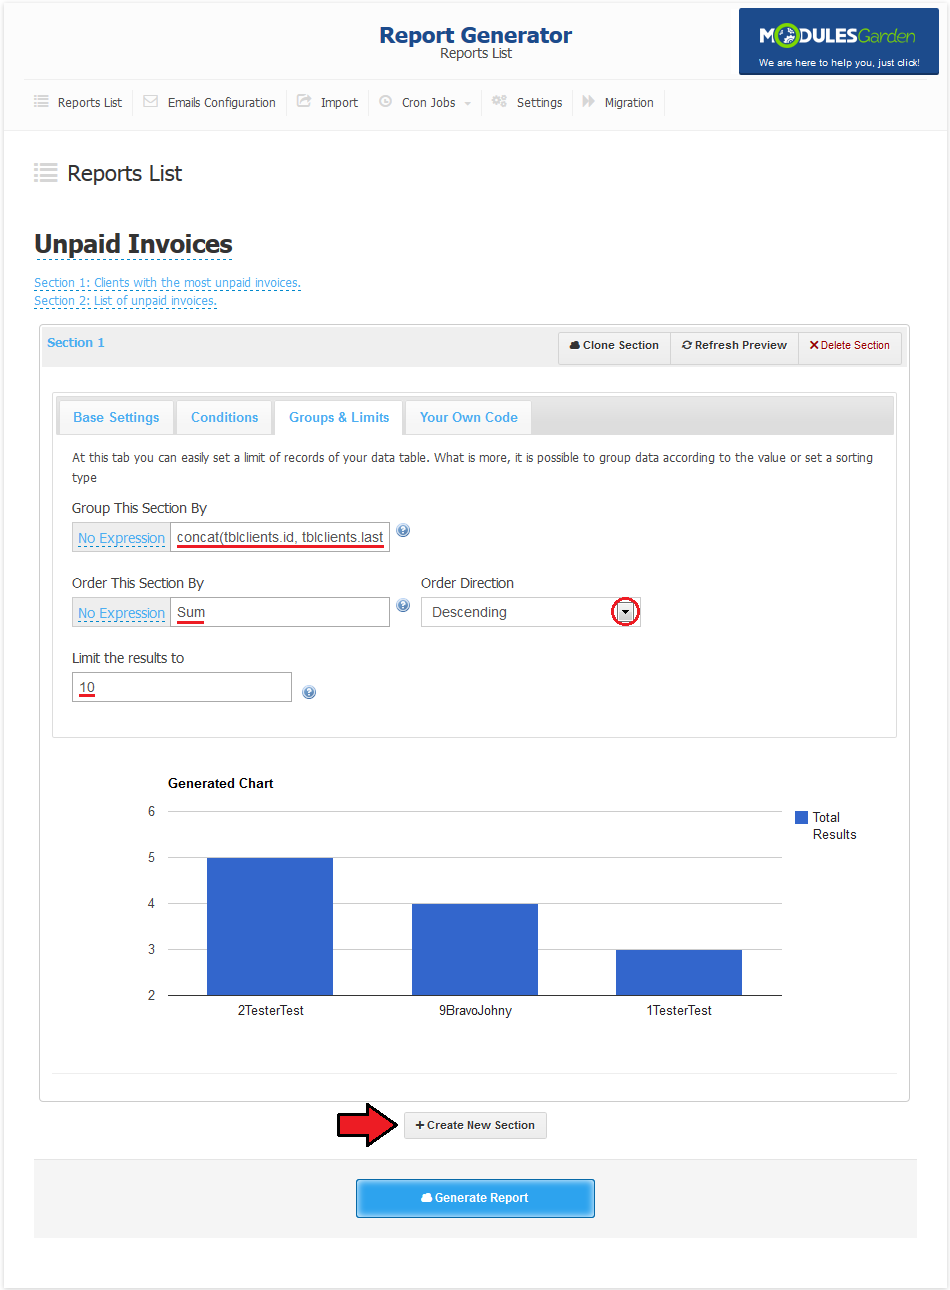
| − | |style="padding: 0px 0px | + | |style="padding: 0px 0px 15px 15px;"|Fill '' 'concat(tblclients.id, tblclients.lastname, tblclients.firstname)' '' into '' 'Group This Section By' '' field.<br /> |
| + | Owing to previously introduced concat you can both make sure you will be counting invoices properly and display string generated by concat under summary column in table.<br /> | ||
| + | This concat returns client ID, lastname and firstname in one string.<br /> | ||
| + | Order records using '' 'Sum' '' alias and define limit of column for this report.<br /> | ||
| + | Now, let's create second section. To do so, press '' 'Create New Section' ''. | ||
|} | |} | ||
| − | |||
| − | |||
{| | {| | ||
| − | |style="padding: | + | |style="padding: 0px 0px 20px 25px;"|[[File:RG_36.png]] |
| − | + | ||
|} | |} | ||
{| | {| | ||
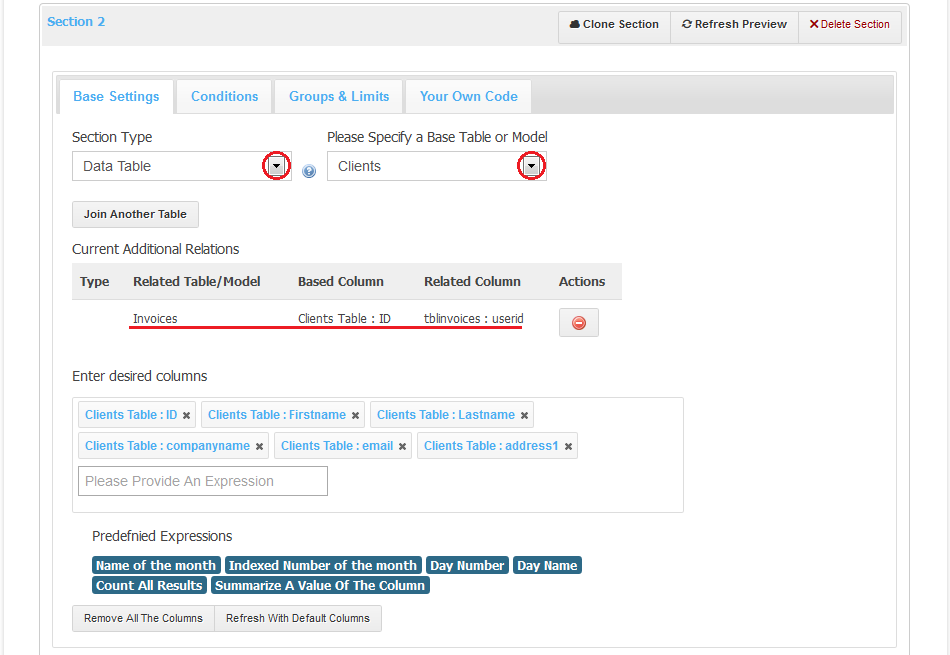
| − | |style="padding: 0px 0px | + | |style="padding: 0px 0px 15px 15px;"|In this section we want to display list of all unpaid invoices of selected client.<br /> |
| + | Select date table and start of client table.<br /> | ||
| + | Additionally, join client table with invoice table as in previous section. | ||
|} | |} | ||
{| | {| | ||
| − | |style="padding: 0px 0px 20px | + | |style="padding: 0px 0px 20px 25px;"|[[File:RG_37.png]] |
|} | |} | ||
{| | {| | ||
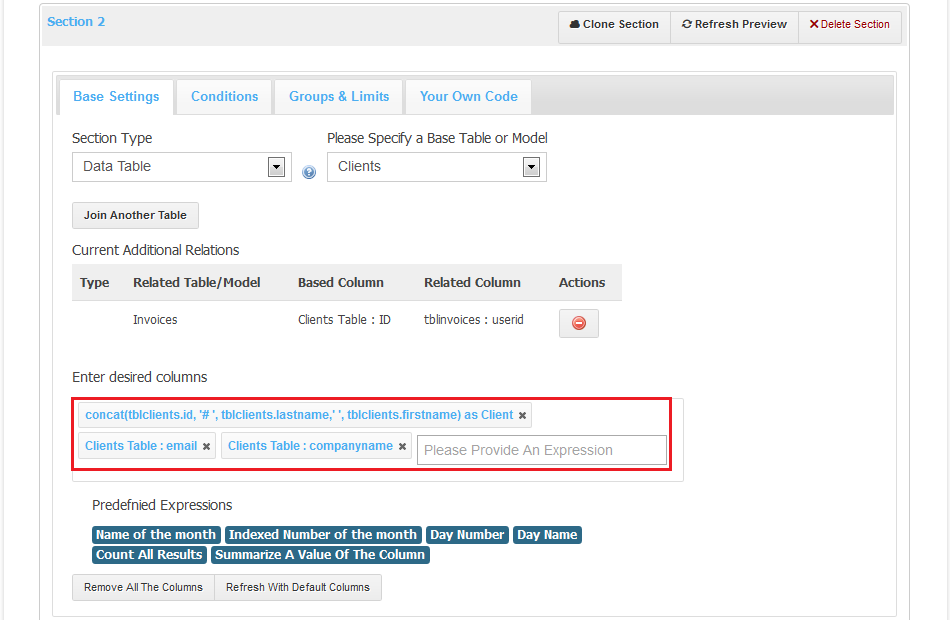
| − | |style="padding: 0px 0px | + | |style="padding: 0px 0px 15px 15px;"|Now, add desired columns. As you can see on the following screen, we have used concat to display clients details in first column.<br /> |
| + | Proceed to condition tab and press '' 'Add New Condition' '' button. | ||
|} | |} | ||
{| | {| | ||
| − | |style="padding: 0px 0px 20px | + | |style="padding: 0px 0px 20px 25px;"|[[File:RG_38.png]] |
|} | |} | ||
{| | {| | ||
| − | |style="padding: 0px 0px | + | |style="padding: 0px 0px 15px 15px;"|There are two conditions to add, their default values are leaved blank so default report will omit there conditions.<br /> |
| + | Nonetheless, you will be able to easily filter for desired client at report view.<br /> | ||
| + | Now, create conditions shown below. | ||
|} | |} | ||
{| | {| | ||
| − | |style="padding: 0px 0px 20px | + | |style="padding: 0px 0px 20px 25px;"|[[File:RG_39.png]] |
|} | |} | ||
{| | {| | ||
| − | |style="padding: 0px 0px 20px 25px;"|[[File: | + | |style="padding: 0px 0px 20px 25px;"|[[File:RG_40.png]] |
|} | |} | ||
{| | {| | ||
| − | |style="padding: 0px 0px | + | |style="padding: 0px 0px 15px 15px;"|Proceed to the '' 'Groups & Limits' '' tab and set up ordering by ID.<br /> |
| + | You can also increase limits of record displayed on the report. | ||
|} | |} | ||
{| | {| | ||
| − | |style="padding: 0px 0px | + | |style="padding: 0px 0px 20px 25px;"|[[File:RG_41.png]] |
|} | |} | ||
| − | |||
| − | |||
{| | {| | ||
| − | |style="padding: | + | |style="padding: 0px 0px 15px 15px;"|Let's proceed to the '' 'Your Own Code' '' section to replace '' 'No Company Assigned' '' with blank field.<br /> |
| + | Copy and paste code placed below: | ||
| + | <?php | ||
| + | foreach($result as $element) | ||
| + | if($element->companyname=='No Company Assigned') | ||
| + | { | ||
| + | $element->companyname=<nowiki>''</nowiki>; | ||
| + | } | ||
| + | ?> | ||
| + | Your report is ready, press '' 'Generate Report' '' to finish. | ||
|} | |} | ||
{| | {| | ||
| − | |style="padding: 0px 0px 30px 25px;"|[[File: | + | |style="padding: 0px 0px 30px 25px;"|[[File:RG_42.png]] |
|} | |} | ||
| − | == | + | ==Modifying Report== |
| + | {| | ||
| + | |style="padding: 10px 0px 20px 15px;"|All reports can be easily altered. Press '' 'Edit' '' next to report that you wish to modify. | ||
| + | |} | ||
| + | {| | ||
| + | |style="padding: 0px 0px 20px 25px;"|[[File:RG_43.png]] | ||
| + | |} | ||
{| | {| | ||
| − | |style="padding: | + | |style="padding: 0px 0px 15px 15px;"|Edit screen is the same as generate screen. Therefore you are allowed to modify and even entirely change report according to your needs.<br /> |
| − | + | For this report we will add filtering results by clients' nationality.<br /> | |
| − | + | Join hosting table with client table as shown on the following screen. | |
| − | + | ||
| − | + | ||
| − | For | + | |
| − | + | ||
| − | + | ||
| − | + | ||
|} | |} | ||
{| | {| | ||
| − | |style="padding: 0px 0px 20px 25px;"|[[File: | + | |style="padding: 0px 0px 20px 25px;"|[[File:RG_44.png]] |
|} | |} | ||
{| | {| | ||
| − | |style="padding: 0px 0px 15px 15px;"| | + | |style="padding: 0px 0px 15px 15px;"|Proceed to the '' 'Conditions' '' tab and press '' 'Add New Filter' ''.<br /> |
| − | + | Filter set up shown on the following screen will filter report output depending of client's country. | |
|} | |} | ||
{| | {| | ||
| − | |style="padding: 0px 0px 30px 25px;"|[[File: | + | |style="padding: 0px 0px 30px 25px;"|[[File:RG_44_1.png]] |
|} | |} | ||
==Email Configuration== | ==Email Configuration== | ||
{| | {| | ||
| − | |style="padding: 10px 0px 15px 15px;"|At '' 'Email Configuration' '' you can set up emails with reports sent to administrators.<br /> | + | |style="padding: 10px 0px 15px 15px;"|At '' 'Email Configuration' '' you can set up emails with PDF reports sent to administrators.<br /> |
| − | + | Start of selecting admin or admins to which email with report should be sent.<br /> | |
| − | Afterwards, choose which of your reports should be sent. | + | Afterwards, choose which of your reports should be sent and decide how often reports should be sent using '' 'Time Period' '' dropdown menu.<br /> |
| + | In addition to that, you can define filter values for generated report if report uses any.<br /> | ||
| + | Confirm through pressing '' 'Add Relation' '' button. | ||
|} | |} | ||
{| | {| | ||
| − | |style="padding: 0px 0px 20px 25px;"|[[File: | + | |style="padding: 0px 0px 20px 25px;"|[[File:RG_45.png]] |
|} | |} | ||
{| | {| | ||
| − | |style="padding: 0px 0px 15px 15px;"| | + | |style="padding: 0px 0px 15px 15px;"|As you can see on the following screen, all relations are listed at the bottom of '' 'Email Configuration' '' page.<br /> |
| − | + | Each of those relations can be removed at any time through pressing '' 'Delete' '' button. | |
| − | + | ||
| − | + | ||
|} | |} | ||
{| | {| | ||
| − | |style="padding: 0px 0px 30px 25px;"|[[File: | + | |style="padding: 0px 0px 30px 25px;"|[[File:RG_46.png]] |
|} | |} | ||
==Import== | ==Import== | ||
{| | {| | ||
| − | |style="padding: 10px 0px | + | |style="padding: 10px 0px 15px 15px;"|To import report from the XML file into your Report Generator, go to the '' 'Import' '' tab.<br /> |
| + | Press '' 'Browse' '' button and select your report XML file.<br /> | ||
| + | Afterwards, press '' 'Upload' '' button and your report will be uploaded into the module. | ||
|} | |} | ||
{| | {| | ||
| − | |style="padding: 0px 0px 20px 25px;"|[[File: | + | |style="padding: 0px 0px 20px 25px;"|[[File:RG_47.png]] |
|} | |} | ||
{| | {| | ||
| − | |style="padding: 0px 0px 15px 15px;"| | + | |style="padding: 0px 0px 15px 15px;"|Imported report should be renamed afterwards.<br /> |
| − | + | Press '' 'Update Report' '' as soon as you finish. | |
|} | |} | ||
{| | {| | ||
| − | |style="padding: 0px 0px 20px 25px;"|[[File: | + | |style="padding: 0px 0px 20px 25px;"|[[File:RG_48.png]] |
|} | |} | ||
{| | {| | ||
| − | |style="padding: 0px 0px | + | |style="padding: 0px 0px 20px 15px;"|Now you can go to the '' 'Reports List' '' to see that your report has been successfully imported and it is ready to use. |
| − | + | ||
|} | |} | ||
{| | {| | ||
| − | |style="padding: 0px 0px | + | |style="padding: 0px 0px 30px 25px;"|[[File:RG_49.png]] |
|} | |} | ||
| + | |||
| + | ==Default Reports Settings== | ||
{| | {| | ||
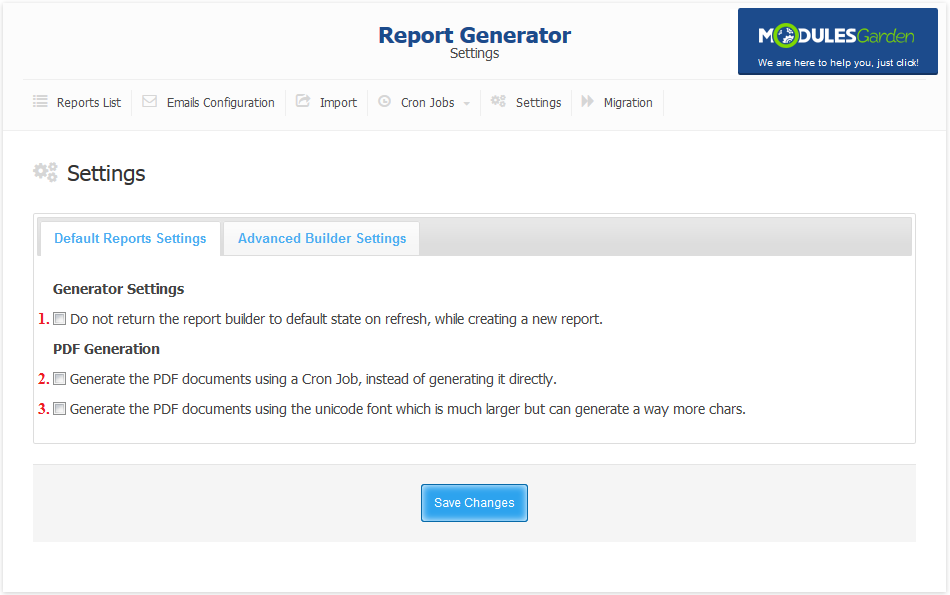
| − | |style="padding: 0px | + | |style="padding: 10px 0px 15px 15px;"|At the '' 'Settings' '' → '' 'Default Reports Settings' '' tab you are allowed to define a few behaviors of our module.<br /> |
| + | 1. Protects generating reports from data lost during refreshing.<br /> | ||
| + | 2. Pressing '' 'To PDF' '' adds a cron job which will generate a PDF report for you.<br /> | ||
| + | Reports generated by cron are available at the '' 'Cron Jobs' '' → '' 'Cron Generated Reports' ''.<br /> | ||
| + | 3. Font used to generate PDF reports is switched to font, which supports unicode.<br /> | ||
| + | During this option being enabled, generated PDF reports are much larger than earlier. | ||
|} | |} | ||
{| | {| | ||
| − | |style="padding: 0px 0px 30px 25px;"|[[File: | + | |style="padding: 0px 0px 30px 25px;"|[[File:RG_50.png]] |
|} | |} | ||
| + | |||
| + | ==Tables And Columns Definitions== | ||
| + | {| | ||
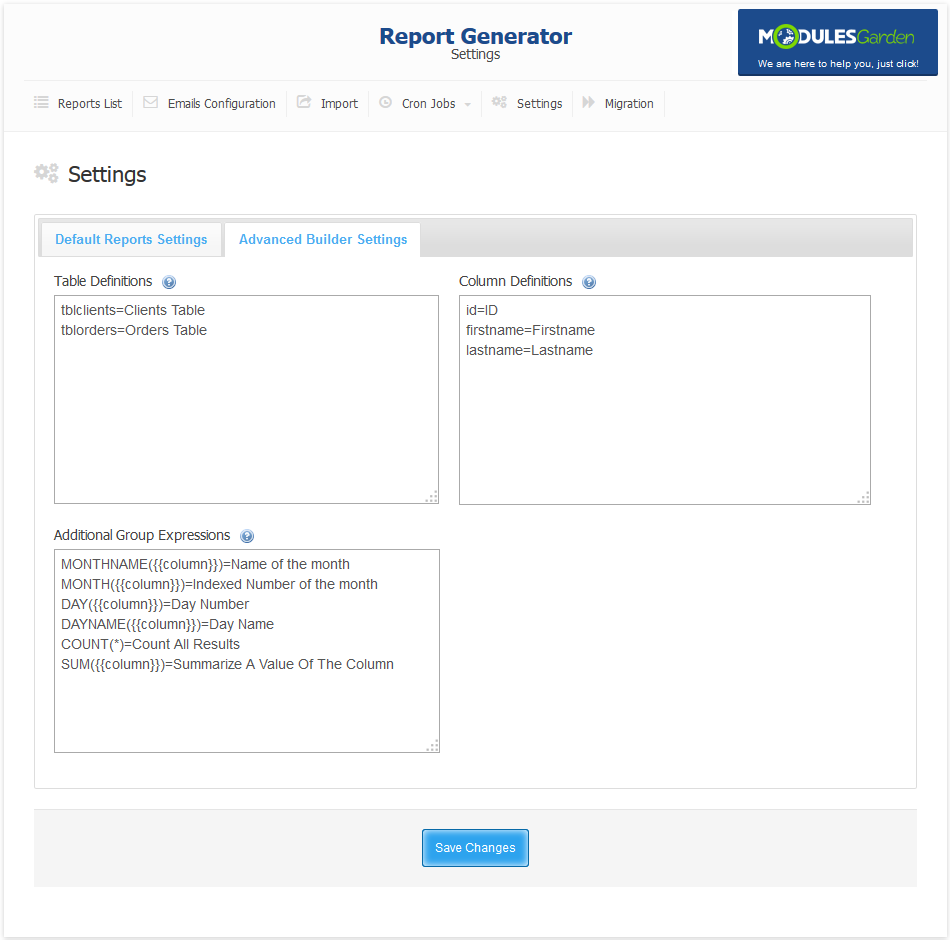
| + | |style="padding: 10px 0px 15px 15px;"|Our module allows you to set up custom table and column names. It is very simple.<br /> | ||
| + | Go to the '' 'Report Generator' '' → '' 'Settings' '' → '' 'Advanced Builder Settings' ''. As you can see, there are three text fields.<br /> | ||
| + | First one, '' 'Table Definitions' '' enables you to easily change name of the tables visible at the reports created by module.<br /> | ||
| + | Second one, '' 'Column Definitions' '' does the same thing for columns.<br /> | ||
| + | '' 'Additional Group Expressions' '' field, lets you set up predefined MySQL expressions which afterwards may be added through one click.<br /> | ||
| + | ''Note 1: '' 'Column Definitions' '' will set up custom name for all columns with that name.'' | ||
| + | |} | ||
| + | {| | ||
| + | |style="padding: 0px 0px 30px 25px;"|[[File:RG_51.png]] | ||
| + | |} | ||
| + | |||
| + | ==Migration== | ||
| + | {| | ||
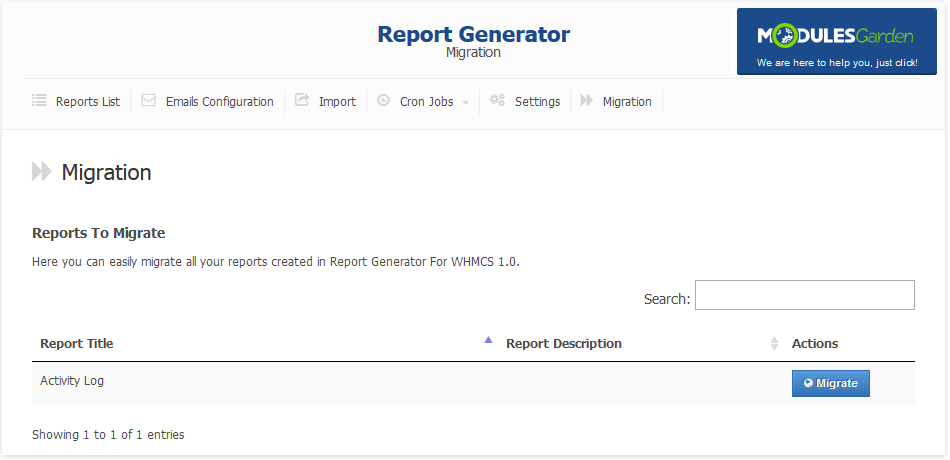
| + | |style="padding: 10px 0px 15px 15px;"|Due to changes in the module and its structure, upgrading it from version 1.0 requires migration tool.<br /> | ||
| + | It can be accessed at the '' 'Migration' '' tab of our module and allows you to migrate reports from the previous version of Report Generator For WHMCS.<br /> | ||
| + | As you can see, all reports which existed in version 1.0 are listed here. In order to import report from the previous version of the module press '' 'Migrate' '' button next to it.<br /> | ||
| + | '''Important: Email settings will be lost during upgrade.''' | ||
| + | |} | ||
| + | {| | ||
| + | |style="padding: 0px 0px 20px 25px;"|[[File:RG_52.png]] | ||
| + | |} | ||
| + | {| | ||
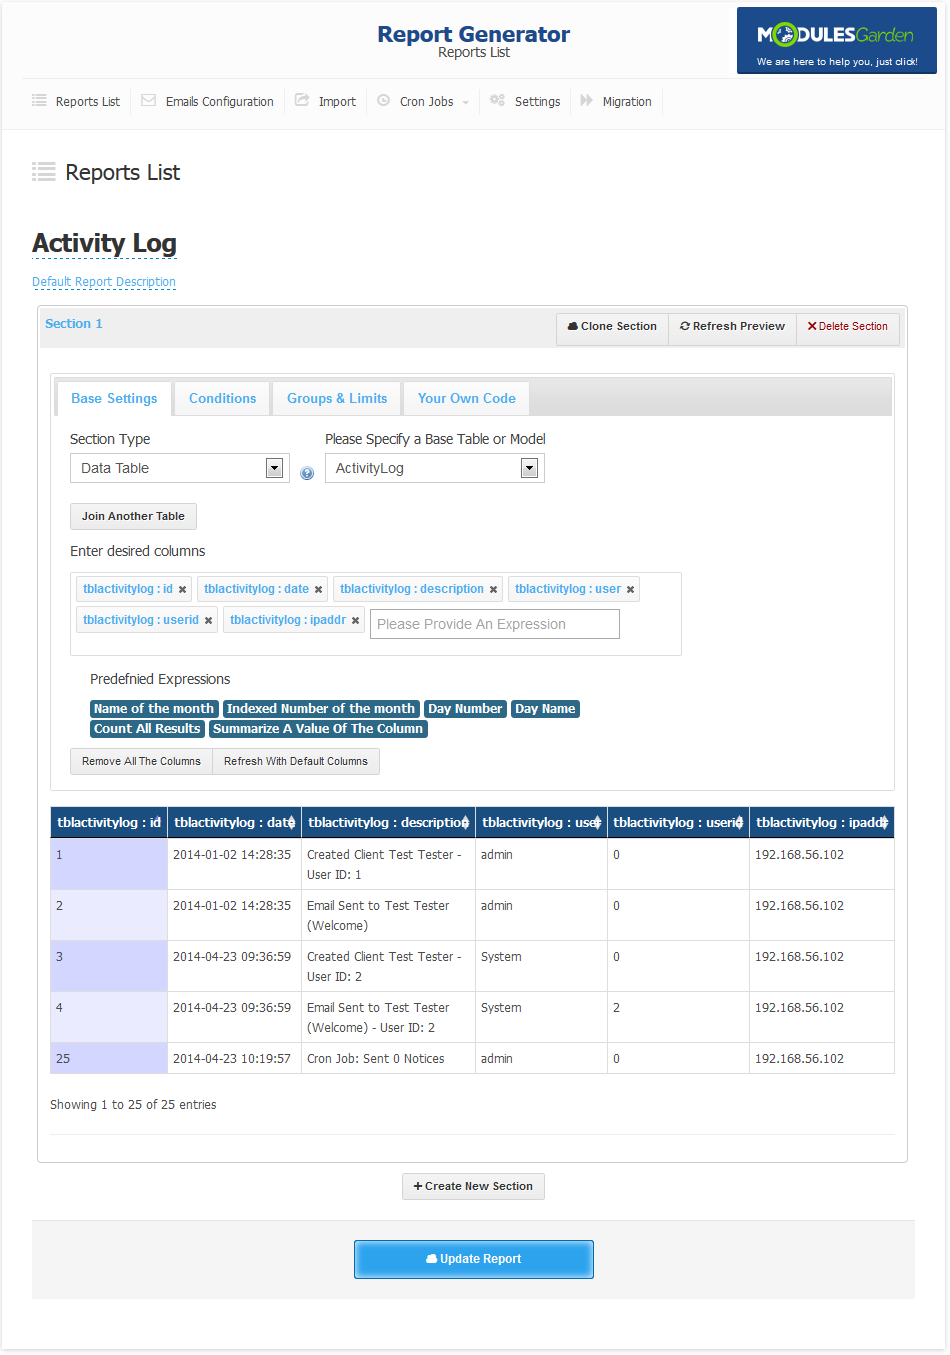
| + | |style="padding: 0px 0px 20px 15px;"|Afterwards, press '' 'Update Report' '' button. Your report is now available at the '' 'Reports List' '' → '' 'User Generated Reports' ''. | ||
| + | |} | ||
| + | {| | ||
| + | |style="padding: 0px 0px 30px 25px;"|[[File:RG_53.png]] | ||
| + | |} | ||
| + | |||
=Tips= | =Tips= | ||
{| | {| | ||
| − | |style="padding: 10px 0px | + | |style="padding: 10px 0px 10px 15px;"|1. In order to work properly, module requires PHP with a PDO support. |
|} | |} | ||
| + | {| | ||
| + | |style="padding: 0px 0px 30px 15px;"|2. There is workaround which enables you to copy report. Simply export report to XML structure and import report from a received file. | ||
| + | |} | ||
| + | |||
=Common Problems= | =Common Problems= | ||
{| | {| | ||
Revision as of 15:27, 29 May 2014
Contents |
About Report Generator For WHMCS
| Report Generator For WHMCS is a module that allows you to create custom reports using SQL query builder and display them in tables and graphs. You can also generate report in XML or PDF and send it over email to specified staff members. |
- Admin Area Features:
| ✔ Drag & Drop WYSIWYG Report Builder |
| ✔ Dynamic Reports Editing |
| ✔ Report Types(Data Table, Pie Chart, Area Chart, Column Chart) |
| ✔ Predefined Reports |
| ✔ User Created Reports |
| ✔ Multi-Sections Of Dynamically Generated Reports |
| ✔ Dynamic Filters |
| ✔ Predefined SQL Expressions At The Report Builder |
| ✔ Multiple Joins At The Report Builder |
| ✔ Two View Types Of Report Pages (Simple And Widget Alike) |
| ✔ Print Reports With Print Preview |
| ✔ Schedule Automatic Reports Sending To Chosen Staff Members With Specified Conditions |
| ✔ Export To CSV, XML and XML Structure |
| ✔ Export To CSV From Report View - Allows You To Set Up Undefault Value Of Filter |
| ✔ Import From The XML Structure |
| ✔ Generate PDF - Both Manually And By Cron Job |
| ✔ Translation Of Database Columns And Tables From The Settings Tab |
| ✔ Enable Unicode Font For Generated PDF |
- Additionally:
| ✔ Multi-Language Support |
| ✔ Supports WHMCS V5 and Later |
| ✔ User-Friendly Interface |
| ✔ Migration Tool |
- User Created Reports:
| ✔ 1. Section 1: Orders Of Services In Selected Period (Column Chart) |
| ✔ 2. Section 1: Orders Of Services In Time (Column Chart) |
| ✔ 3. Section 1: Orders Over The Weekdays (Pie Chart) |
| ✔ 4. Section 1: Most Valuable Clients (Data Table) |
| ✔ 5. Section 1: User Accounts Created In Selected Period (Data Table) Section 2: Amount Of User Accounts Created In Selected Period (Column Chart) |
| ✔ 6. Section 1: Tickets Replied By Admin (Data Table) Section 2: Tickets Replied By Admin (Data Table) |
| ✔ 7. Section 1: Customers Per Country (Pie Chart) |
- Predefined Reports:
| ✔ 1. Section 1: Open Tickets For The Period (Data Table) Section 2: New Invoices For The Period (Data Table) |
| ✔ 2. Section 1: Closed/Answered Status Tickets By The Staff Member (Data Table) Section 2: Tickets Stats For The Staff Over Time (Area Chart) |
| ✔ 3. Section 1: Opened Tickets Stats For This Staff Over Time (Area Chart) Section 2: To-Do List Tasks Owned By The Staff Member Grouped By Status (Pie Chart) |
Installation
| This tutorial will show you how to successfully install and configure Report Generator For WHMCS. We will guide you step by step through the whole installation and configuration process. |
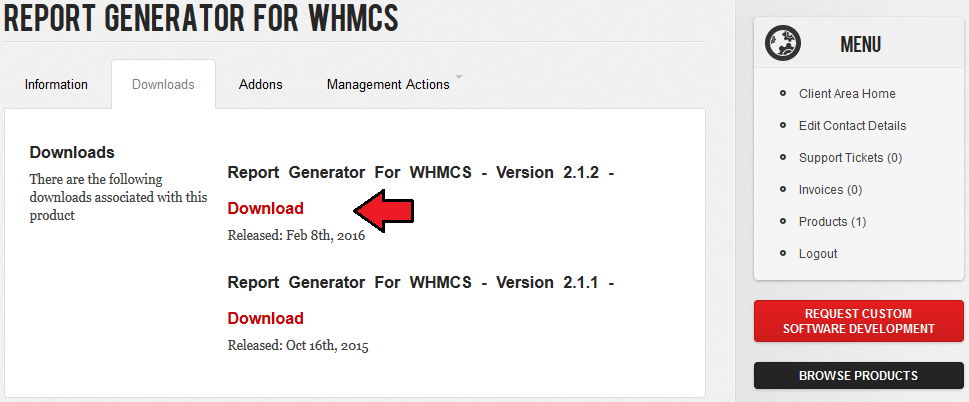
| 1. Log in to your client area and download Report Generator For WHMCS. |
|
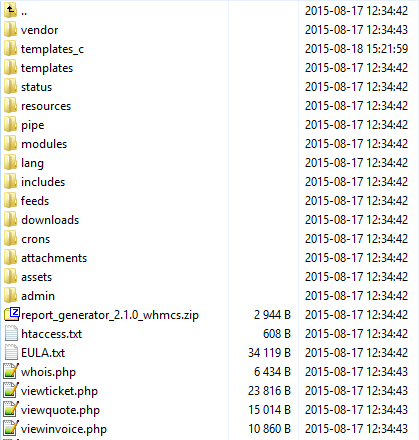
| 2. Upload and extract the module into the main WHMCS directory. Files in your WHMCS directory should look like this. |
|
| 3. Remove all files from 'templates_c' folder. |
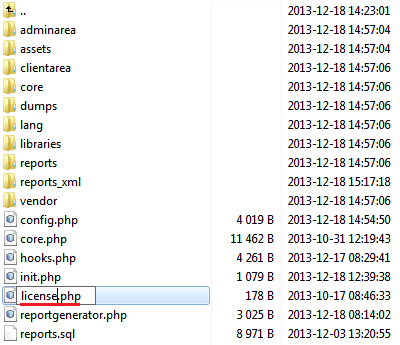
| 4. When you install Report Generator for the first time you have to rename 'license_RENAME.php' file. File is located at 'modules/addons/reportgenerator/license_RENAME.php' . Rename it from 'license_RENAME.php' to 'license.php' . |
|
| 5. In order to configure your license key, you have to edit a previously renamed 'license.php' file.' Enter your license key between quotation marks as presented on the following screen. You can find your license key at your client area → 'My Products' . |

|
| 6. Now you have to set chmod '755' or '777' to all folders in 'storage' folder. 'storage' folder is located at 'your_whmcs/modules/addons/reportgenerator/' . |

|
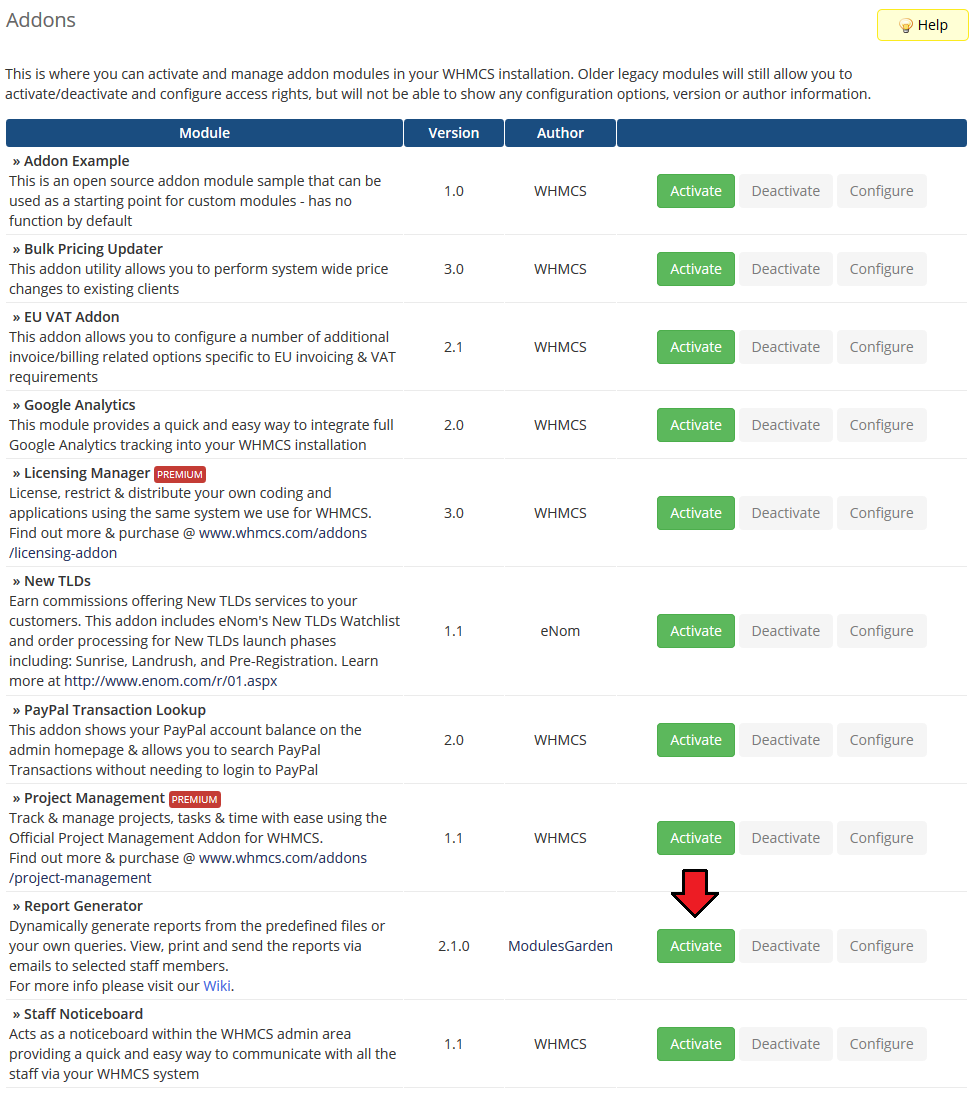
| 7. Now you have to activate the module in your WHMCS system. Log in to your WHMCS admin area. Go to 'Setup' → 'Addon Modules' . Afterwards, find 'Report Generator' and press 'Activate' button. |
|
| 8. In the next step you need to permit access to this module. To do so, click on 'Configure' button, tick 'Full Administrator' and press 'Save Changes' . |
|
| 9. Last step is setting up cron jobs. You can find them at your module 'Addons' → 'Report Generator' → 'Cron Jobs' → 'Cron Setup' . |
|
| 10. You have just successfully installed Report Generator! You can access the module at 'Addons' → 'Report Generator' . |
|
Configuration and Management
| Report Generator For WHMCS allows your to create custom reports using drag & drop WYSIWYG builder. Module also offers additional useful features like predefined reports, import/export of reports, generating reports in PDF, ability to send then to admins and much more. |
Reports List
| At the 'Reports Lists' tab you can view all predefined reports as well as those created by you. Here you can manage your reports by viewing (1), editing (2) and removing them (8). |
|
| For predefined reports you can view report, generate PDF file and export report to CSV and XML. |
|
| To start creation of report press 'Create New Report' . More information about creating new reports will be presented in the Creating Report section. |
|
Report View
| In the report view you can see all tables and charts generated by the report. You can display report in a simple or widget format. To switch between them press one of the buttons marked on the screen below. |
|
PDF Report View
| You can also view a PDF version of report which can be sent to your staff memebers or saved to PDF file on your disk. |
|
Creating Report
| In this section we will show you how to prepare a few example reports. If you wish to create your own report, we strongly recommend to firstly create reports shown below in order to get some practice. |
First Report - User Accounts Created
| At the beginning you have only one section in your report. Each section generates one chart on final report. In order to create additional chart on your report you need to add a new section. |
|
| Now, select desired chart type and table you want to start with. As you can see, default columns was loaded. For purpose of this report we will remove them through pressing 'Remove All The Columns' . |
|
| Adding columns to report is quite easy owing to autocomplete box. Type table name and list of all available columns will show up. Now, select desired column. |
|
| As you may noticed earlier, each change made affects report preview displayed below. In some situations preview may be replaced with error, which will contain information about lacking or miss-configured settings of report. |
|
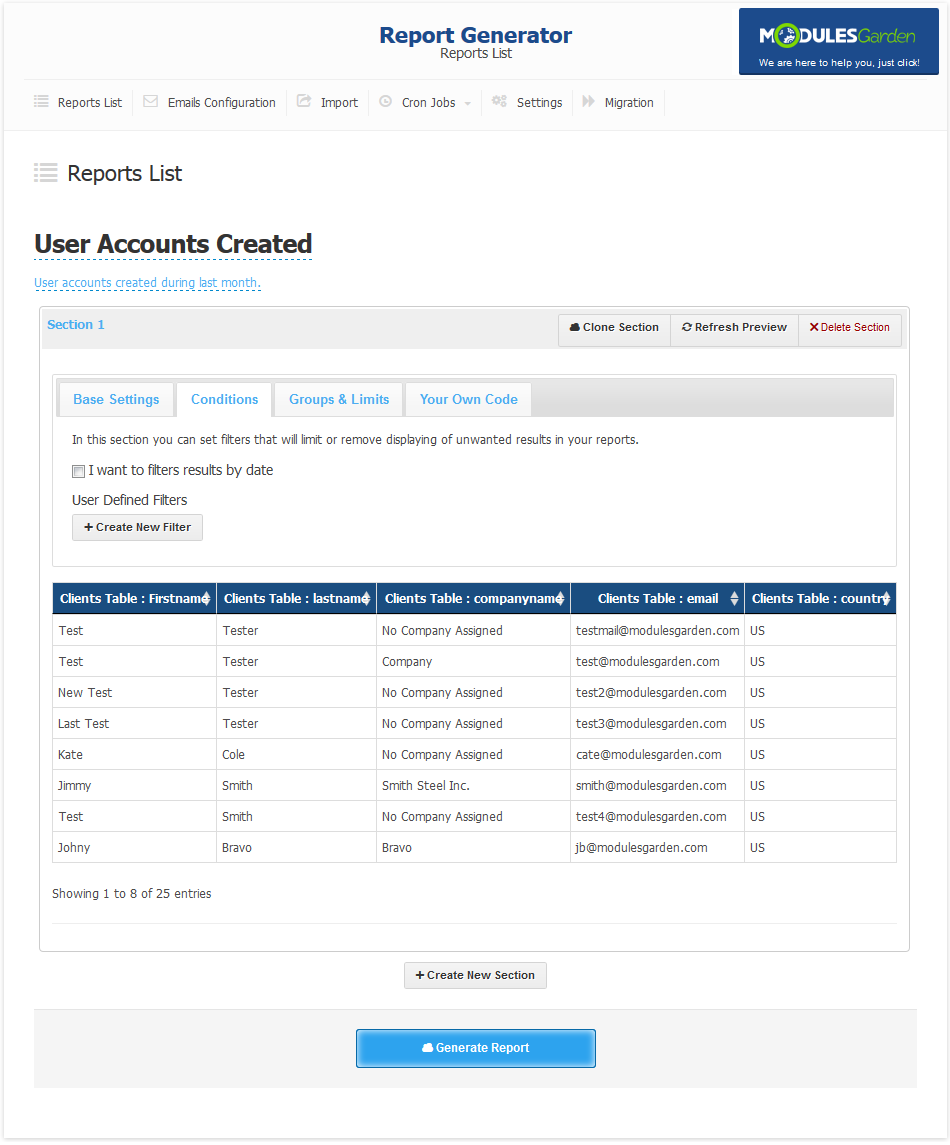
| To set up time period for report, go to the 'Conditions' tab and mark 'Filter results by date' . |
|
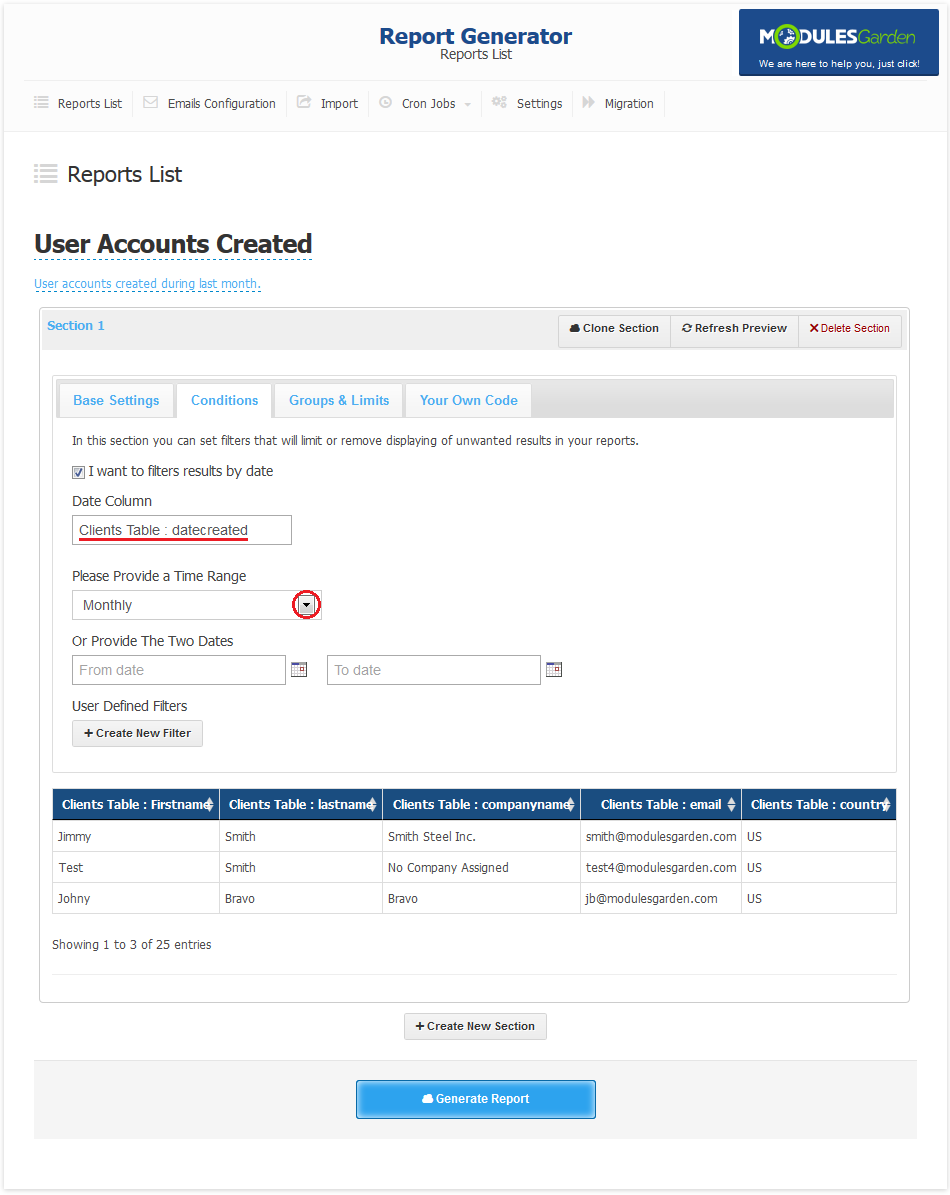
| Afterwards, select 'Clients Table : datecreated' and 'Monthly' from marked dropdown menus. Now, report will be generated using only accounts created during last 30 days. |
|
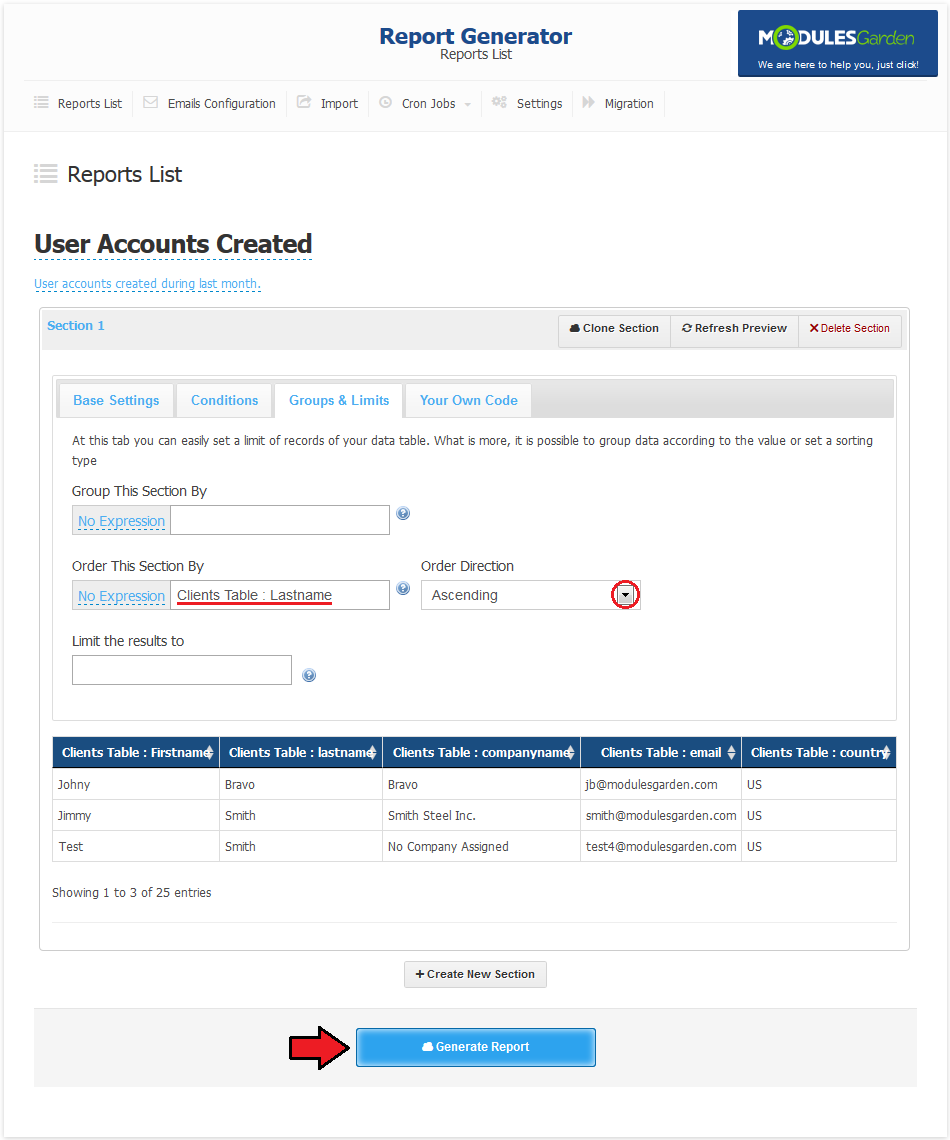
| You can set up ordering records by specific column. To do that, go to the 'Groups & Limits' tab. We will order records by client last name. Choose 'Clients Table : lastname' and 'Ascending' as shown on the following screen. |
|
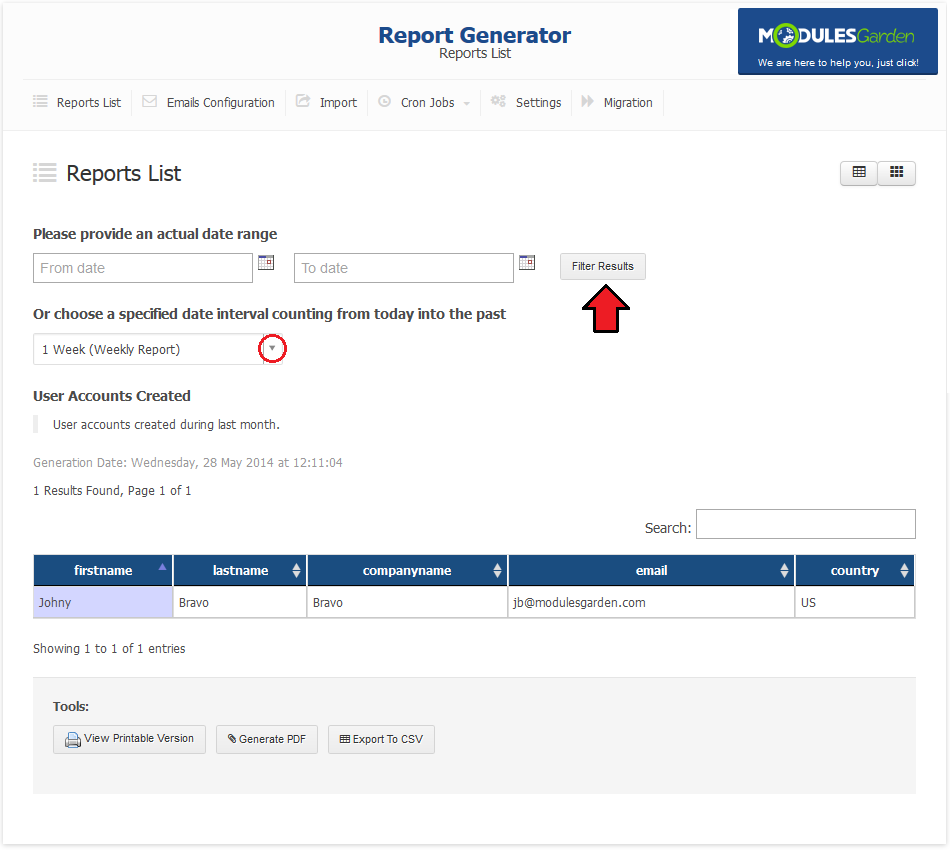
| Let's view that report through pressing 'View' button. As you can see, column names are names of table columns. |
|
Second Report - Orders Per User
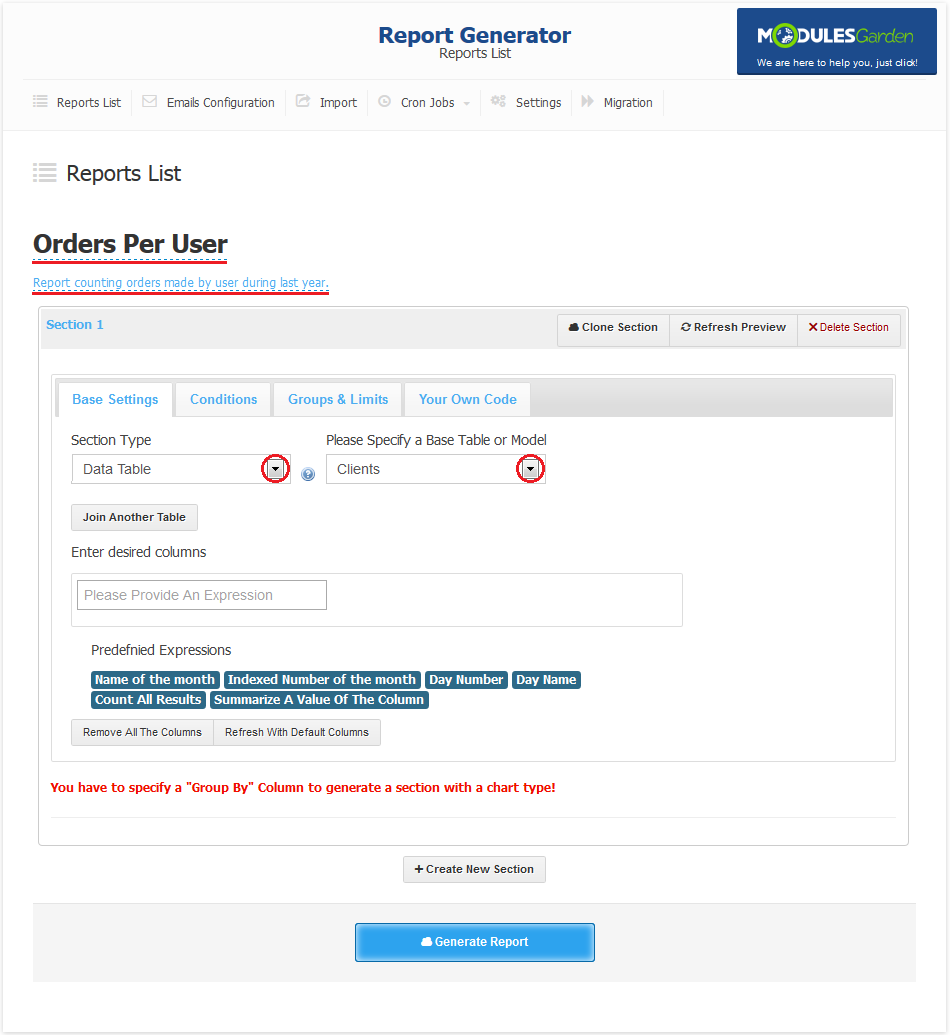
| This report will be counting orders made by clients this year. Due to that, we will need to use group by command to count those products. As previously, start of defining report name and description. Additionally, choose report type and starting table. |
|
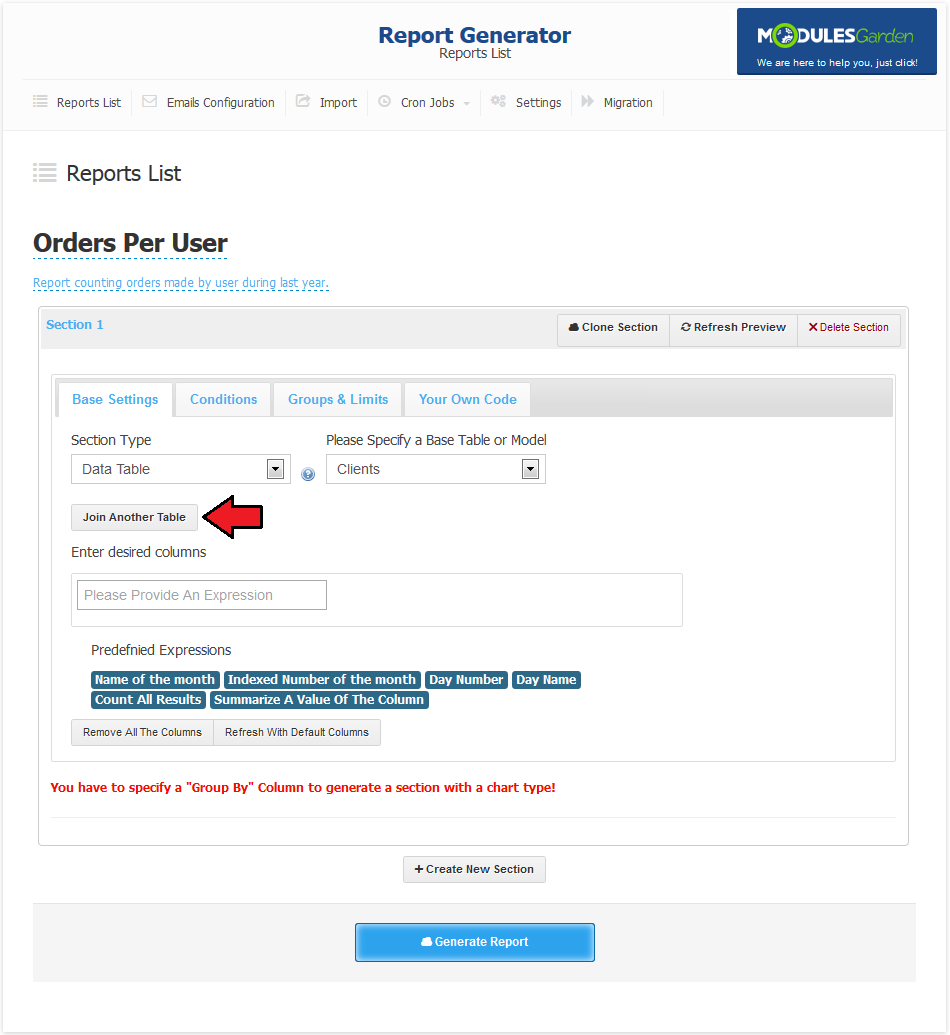
| Join orders table to clients table. We will need it to display columns from both tables here. Press 'Join Another Table' to proceed. |
|
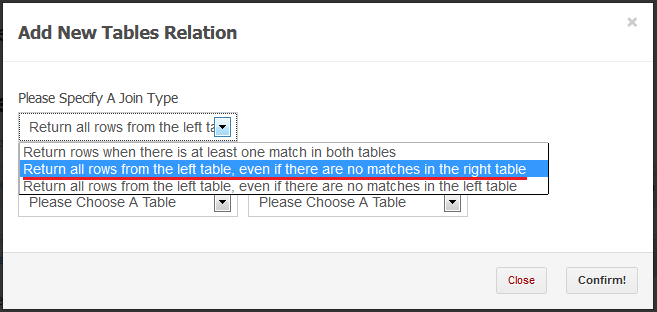
| It is time to think about how we want to connect these two tables. We want to display client even if he has no order, therefore from 'Please Specify A Join Type' we will choose: |
|
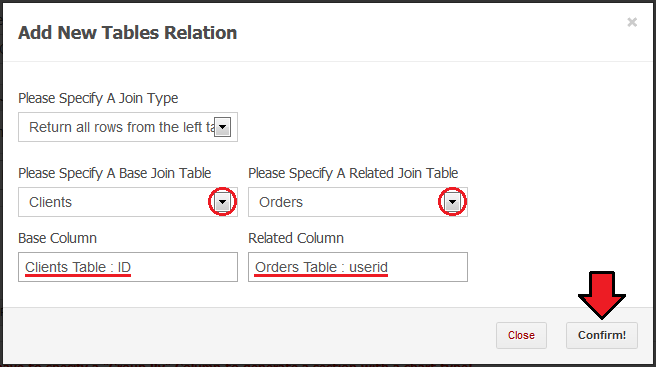
| Now select two tables to join. For purpose of this report it will be tables 'Clients' and 'Orders' . It is time to decide what columns will be used to join chosen columns. |
|
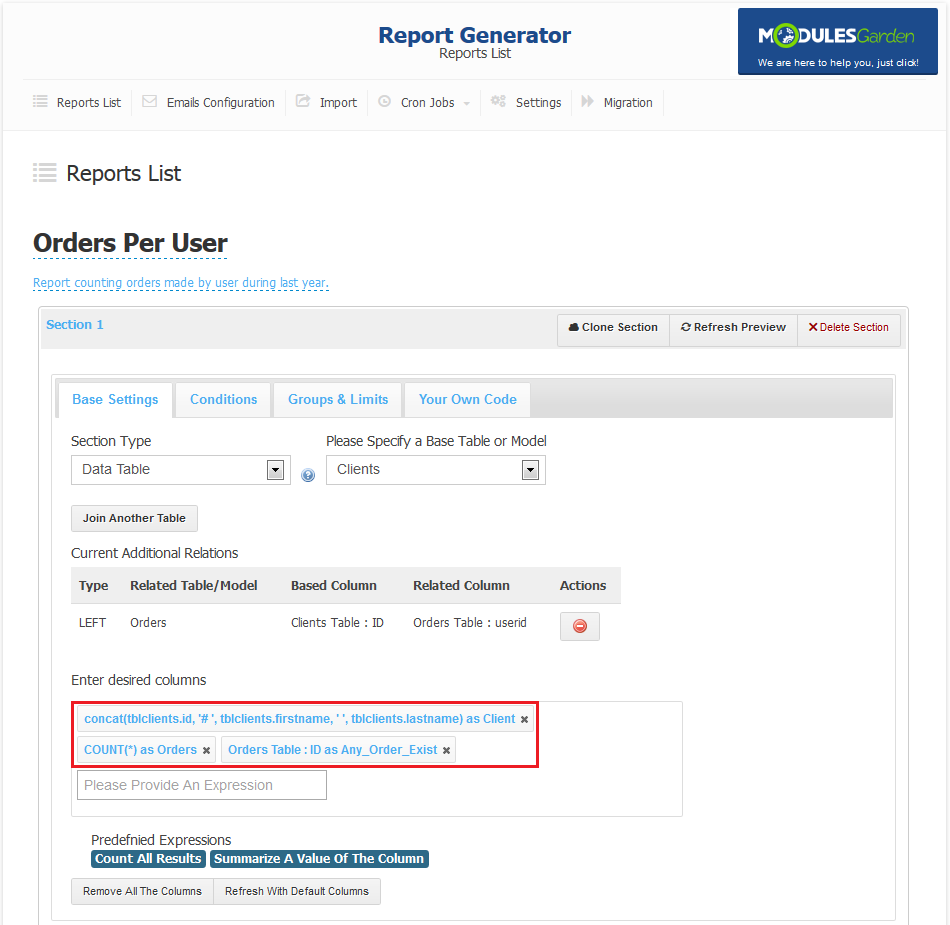
| We want to display clients details in one column and quantity of orders in another one. First column will be displayed by: concat(tblclients.id, '# ', tblclients.firstname, ' ', tblclients.lastname) as Client Concat will join provided columns while 'Client' is alias for this column. Alias will be used for generated report. COUNT(*) as Orders Count along with grouping by allow us to count records for each client. Orders Table : ID as Any_Order_Exist This column was added to handle clients which does not have any orders. |
|
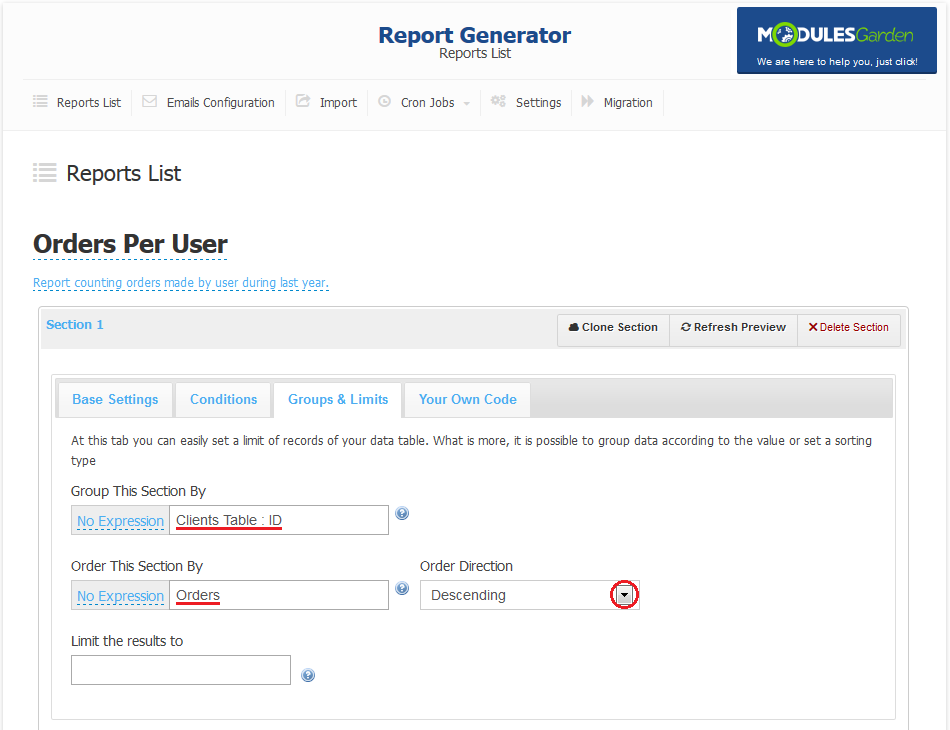
| We want to group records by clients, therefore fill 'Group This Section By' with 'Clients Table : ID' which is unique key at the client table. Additionally, let's set up sorting clients by quantity of orders, we can use column alias for this. |
|
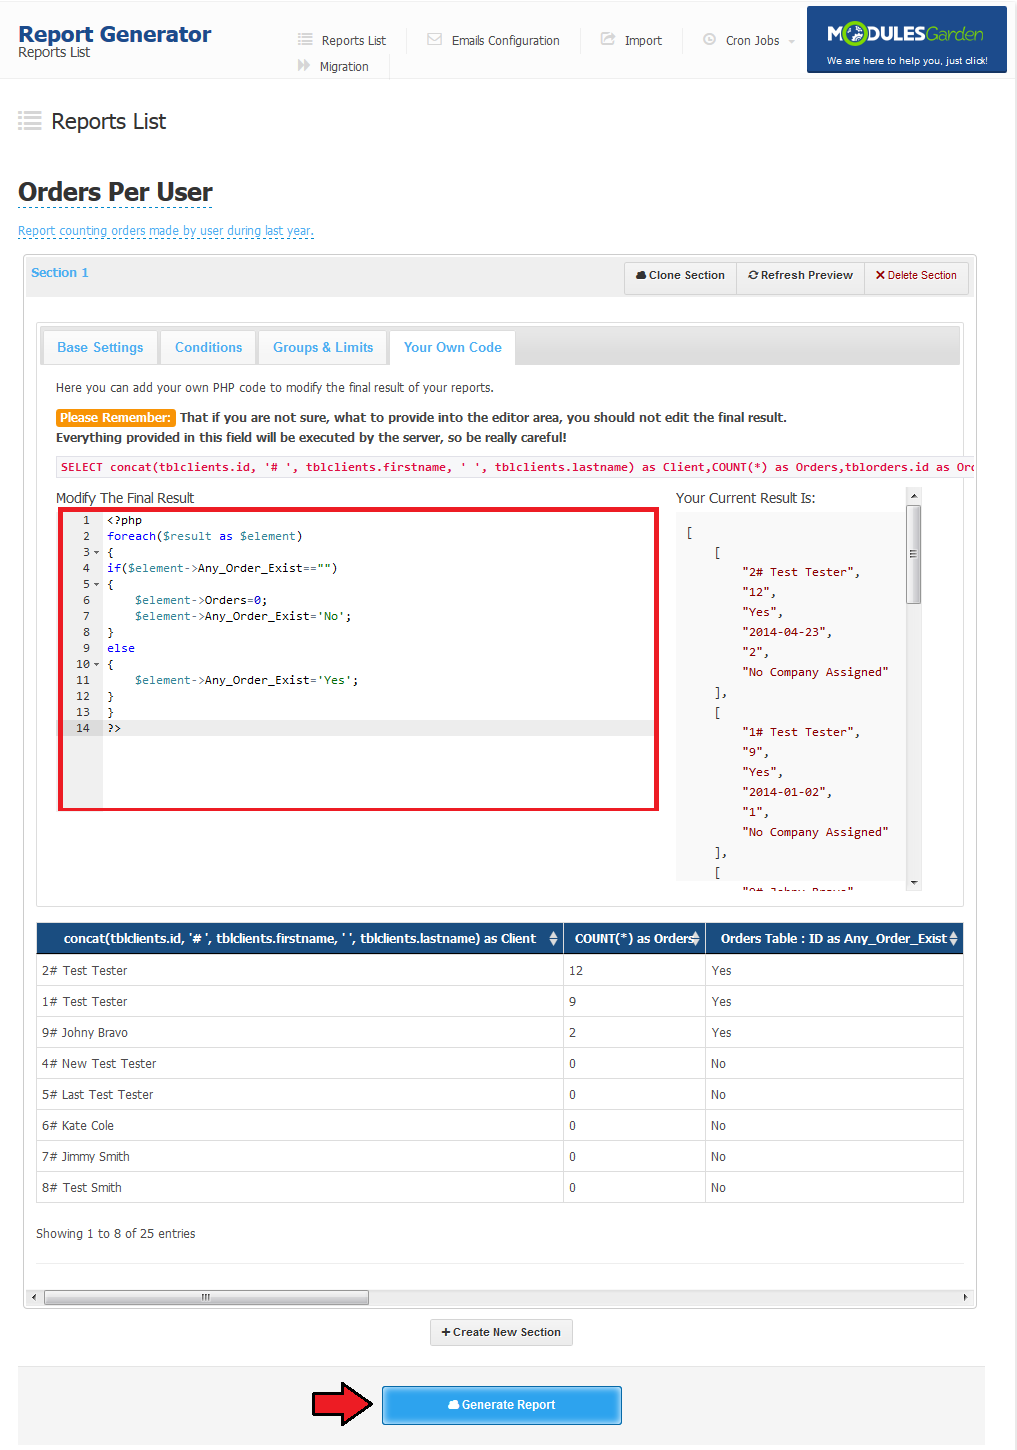
| At 'Your Own Code' tab you can modify received output. Code have to be placed in delimiters as shown below. <?php // your custom code here ?> The '$result' variable is passed by reference and contains just iterated element of the result array. <?php
foreach($result as $element) // iterate over all records storing current row in $element variable
{
if($element->Any_Order_Exist=="") // check if Any_Order_Exist is empty
{
$element->Orders=0; //assign 0 to Orders if Any_Order_Exist is empty
$element->Any_Order_Exist='No'; //assign 'No' to Any_Order_Exist if it is empty
}
else // if previous if was false, commands stored here will be ordered
{
$element->Any_Order_Exist='Yes'; //assign 'Yes' to Any_Order_Exist
}
}
?>
|
|
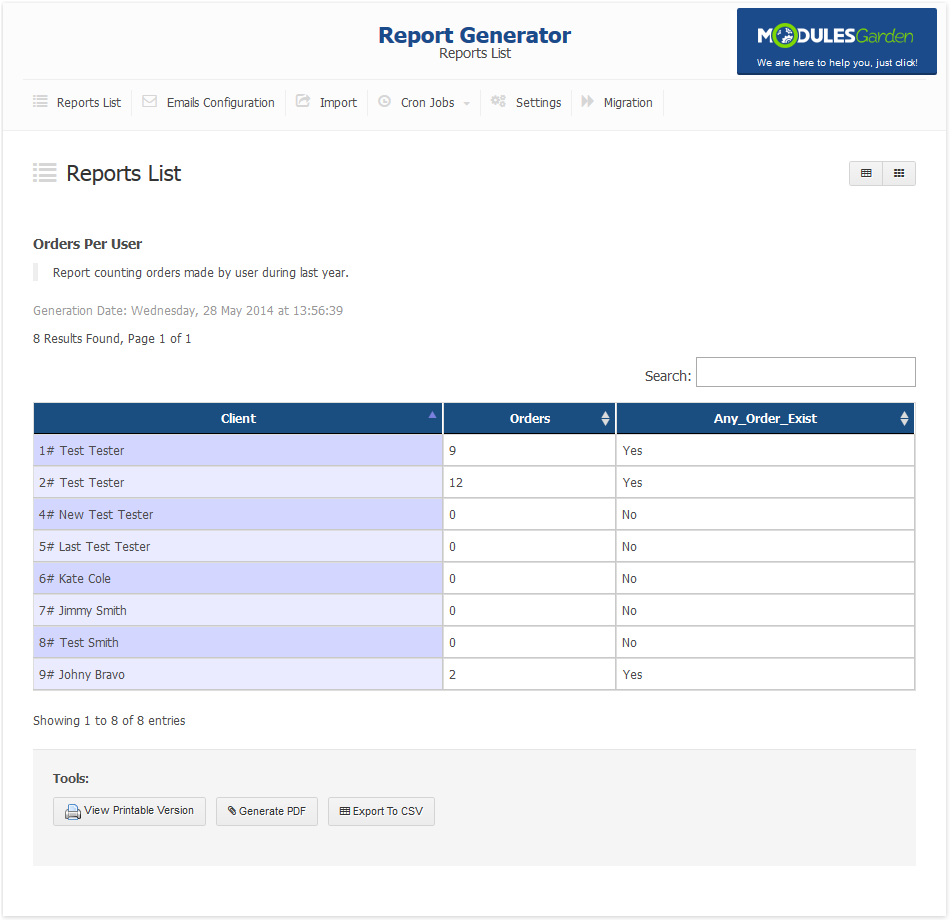
| Your code is ready, press 'Generate Report' to save it. |
|
Third Report - Unpaid Invoices
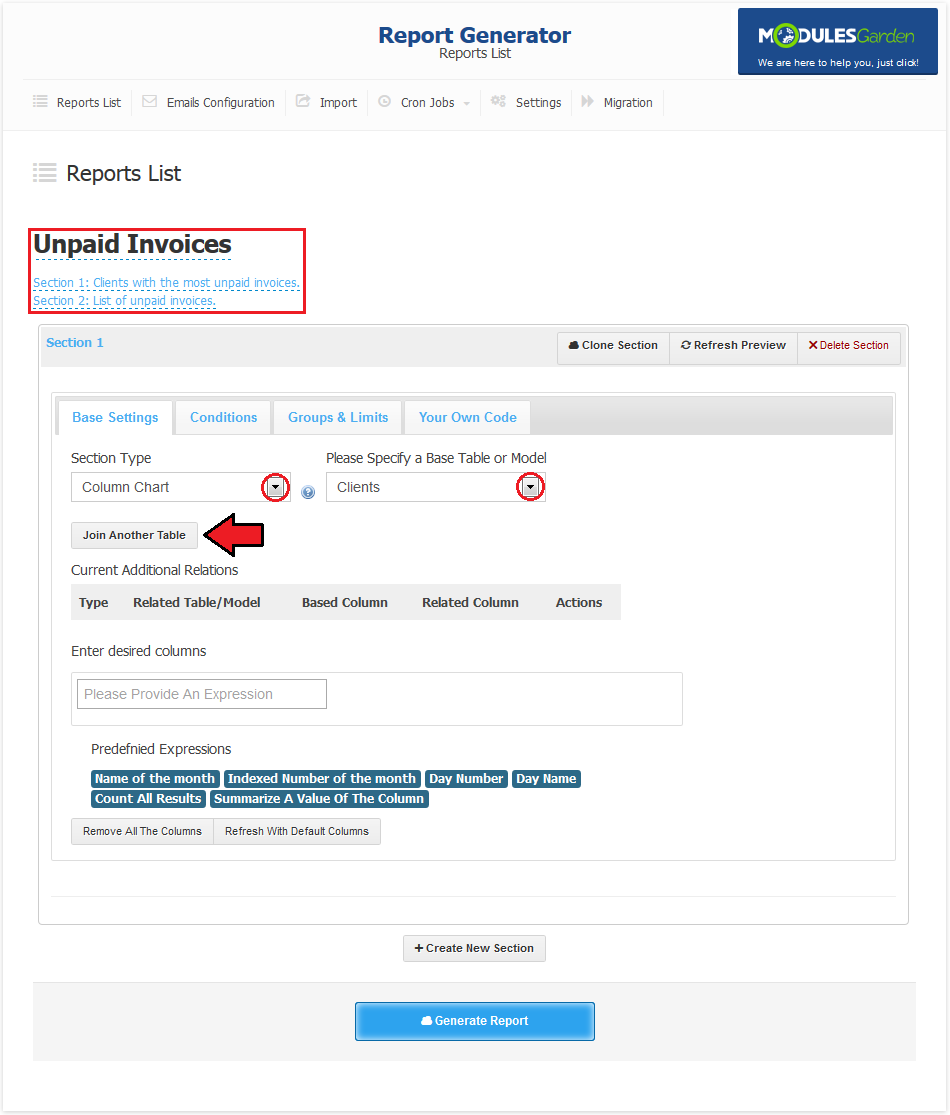
| At the third report we will show you how to prepare report displaying clients with the most unpaid invoices. We will also add second section displaying unpaid invoices which can be filtered by client first and last name. |
|
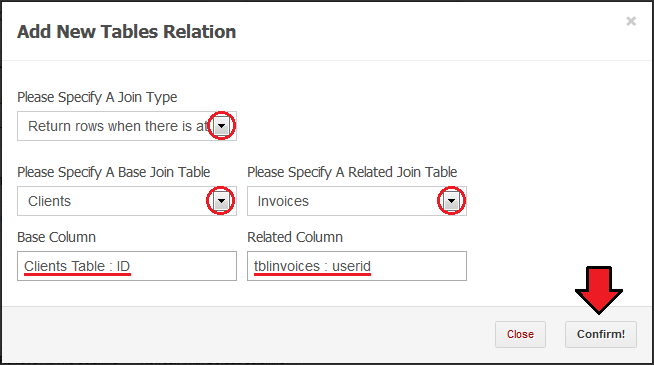
| Now, join invoice table using 'Clients Table : ID' and 'Invoices Table : userid' and set it up to return tables only if there is a match in the invoice table. |
|
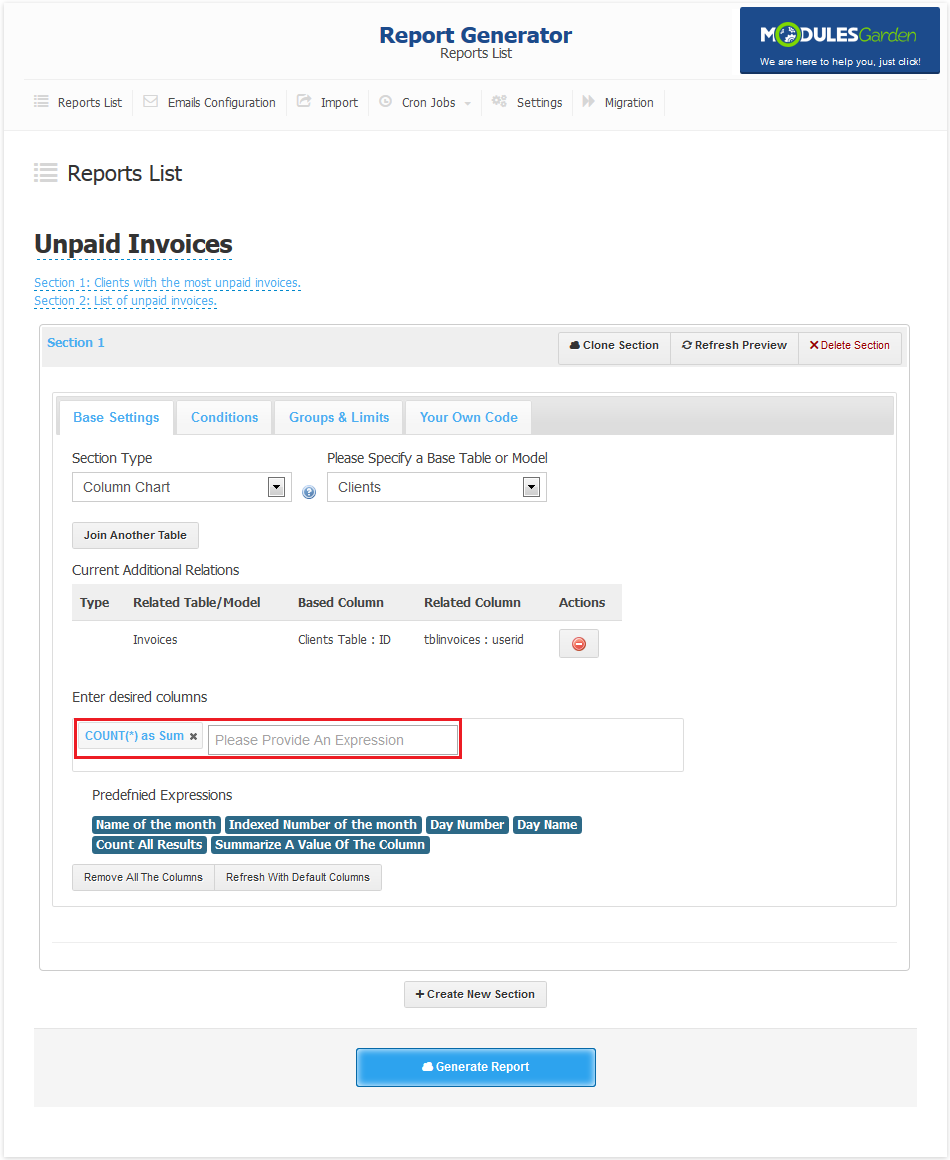
| Add 'COUNT(*) as Sum' column and proceed to the 'Conditions' tab. |
|
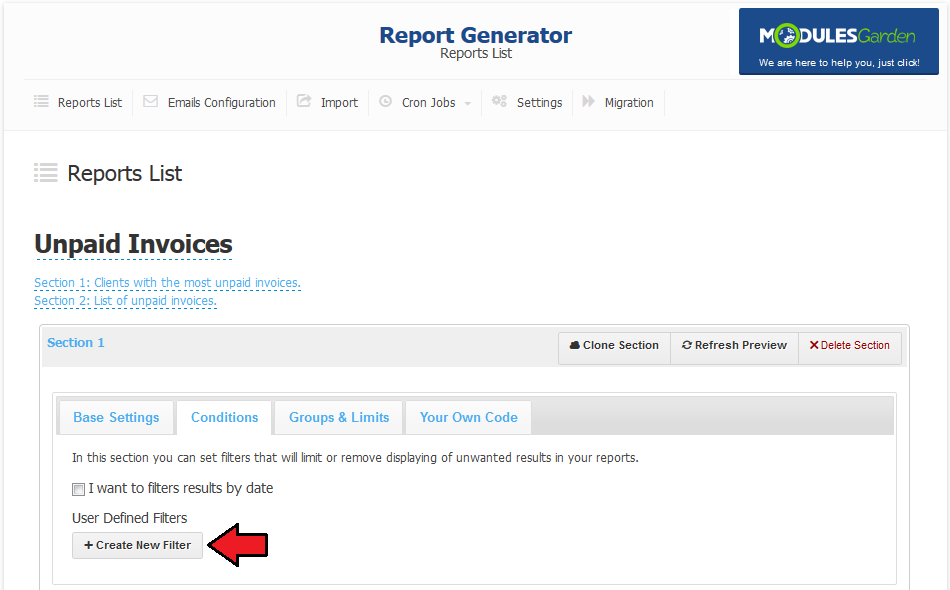
| Press 'Create New Filter' button to define new condition for your report. |
|
| Select column you want to define condition for, select filter operand, define default value of filter and filter friendly name. Conditions can be changed at the report view, they will be displayed under friendly name defined here. |
|
| Fill 'concat(tblclients.id, tblclients.lastname, tblclients.firstname)' into 'Group This Section By' field. Owing to previously introduced concat you can both make sure you will be counting invoices properly and display string generated by concat under summary column in table. |
|
| In this section we want to display list of all unpaid invoices of selected client. Select date table and start of client table. |
|
| Now, add desired columns. As you can see on the following screen, we have used concat to display clients details in first column. Proceed to condition tab and press 'Add New Condition' button. |
|
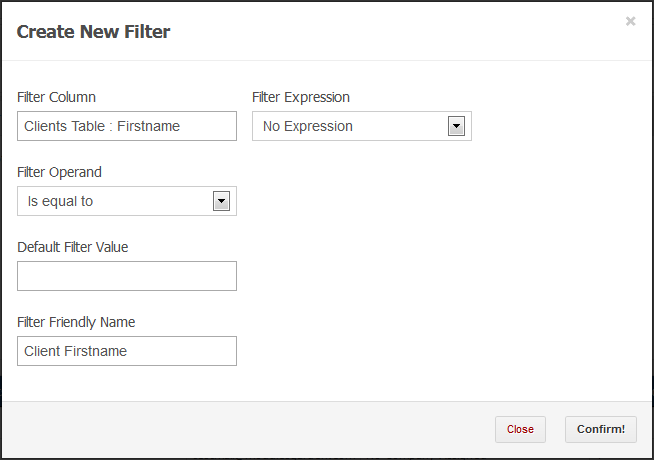
| There are two conditions to add, their default values are leaved blank so default report will omit there conditions. Nonetheless, you will be able to easily filter for desired client at report view. |
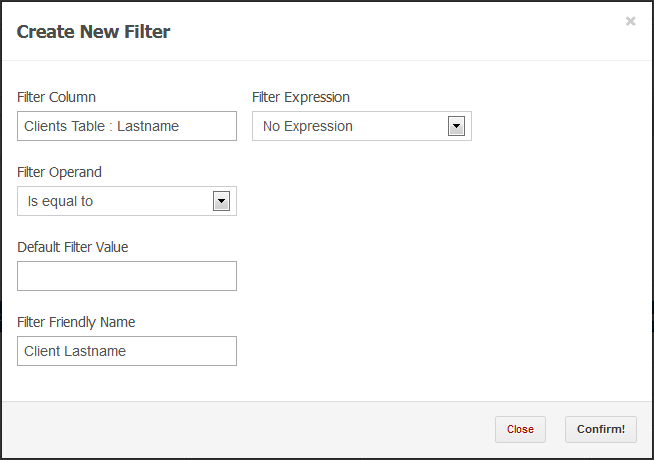
|
|
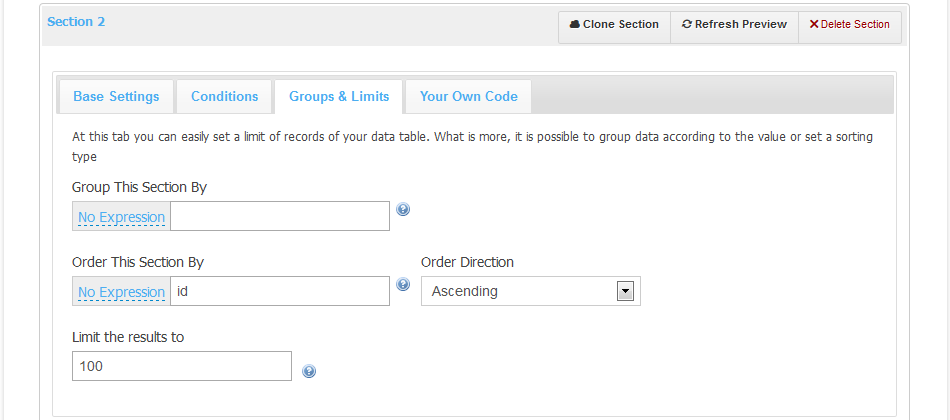
| Proceed to the 'Groups & Limits' tab and set up ordering by ID. You can also increase limits of record displayed on the report. |
|
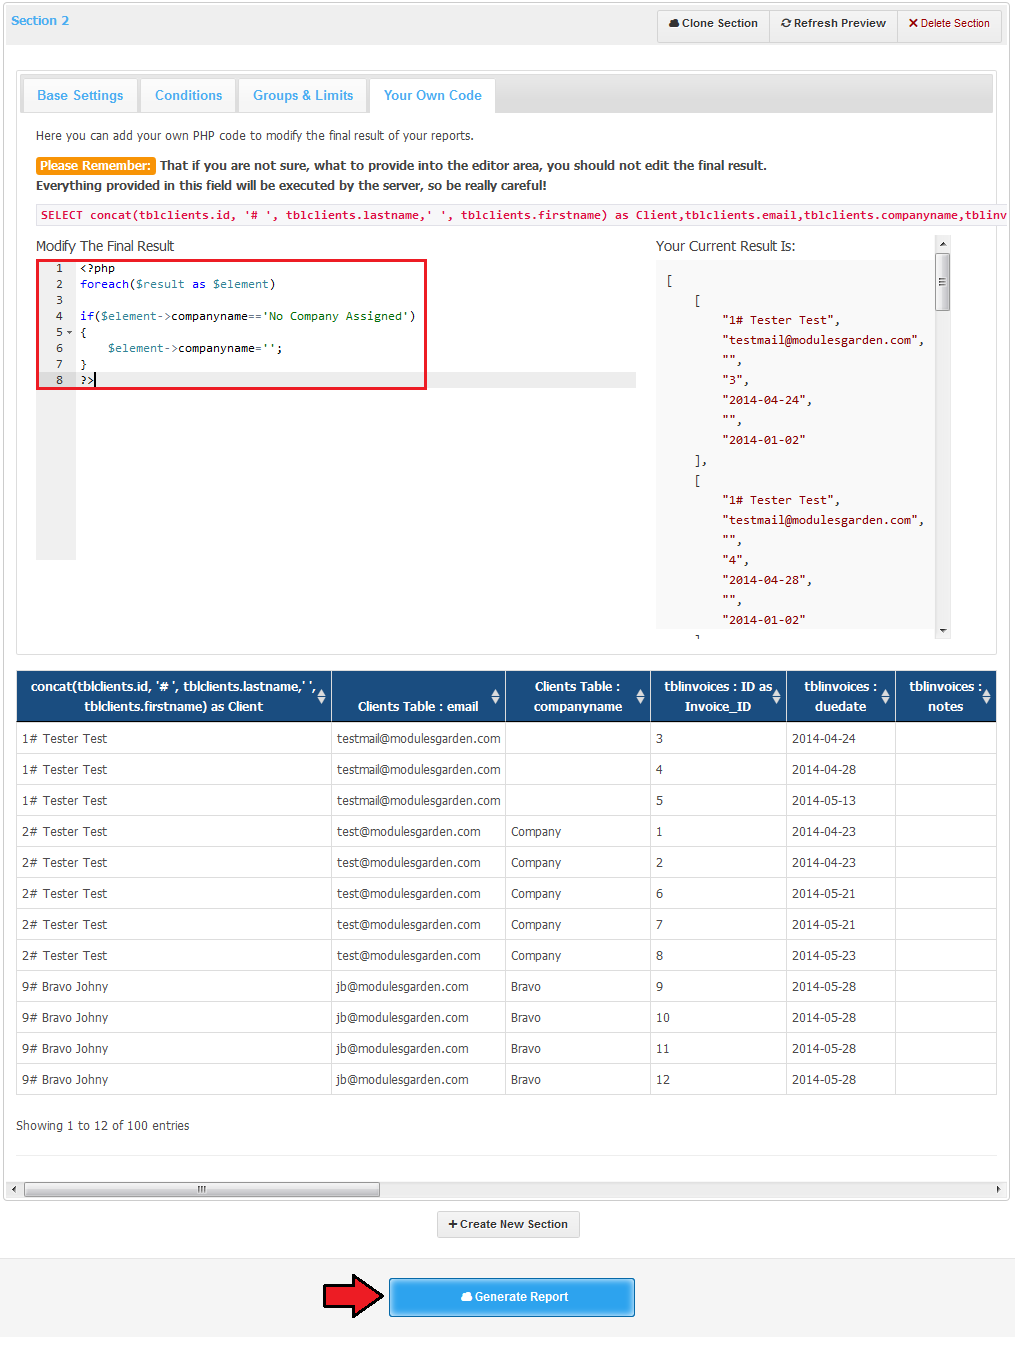
| Let's proceed to the 'Your Own Code' section to replace 'No Company Assigned' with blank field. Copy and paste code placed below: <?php
foreach($result as $element)
if($element->companyname=='No Company Assigned')
{
$element->companyname='';
}
?>
Your report is ready, press 'Generate Report' to finish. |
|
Modifying Report
| All reports can be easily altered. Press 'Edit' next to report that you wish to modify. |
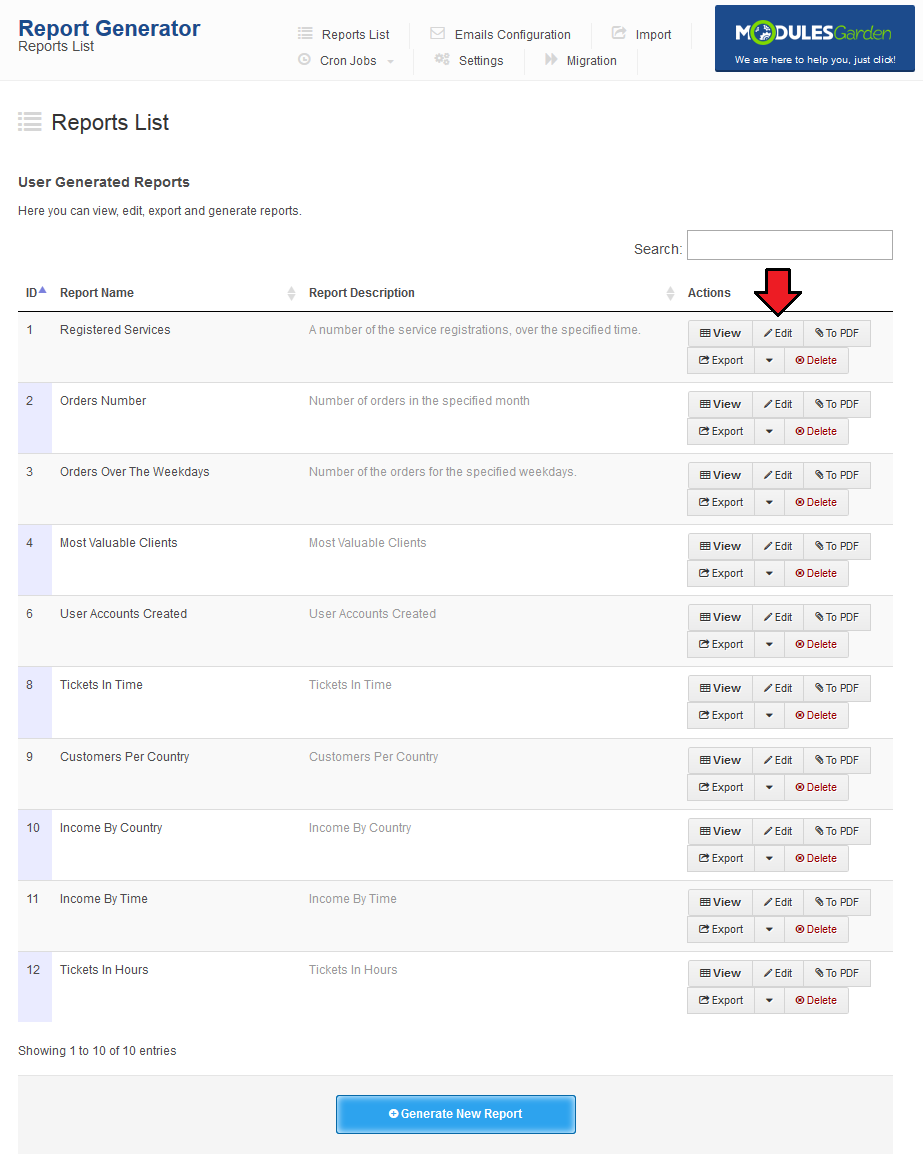
|
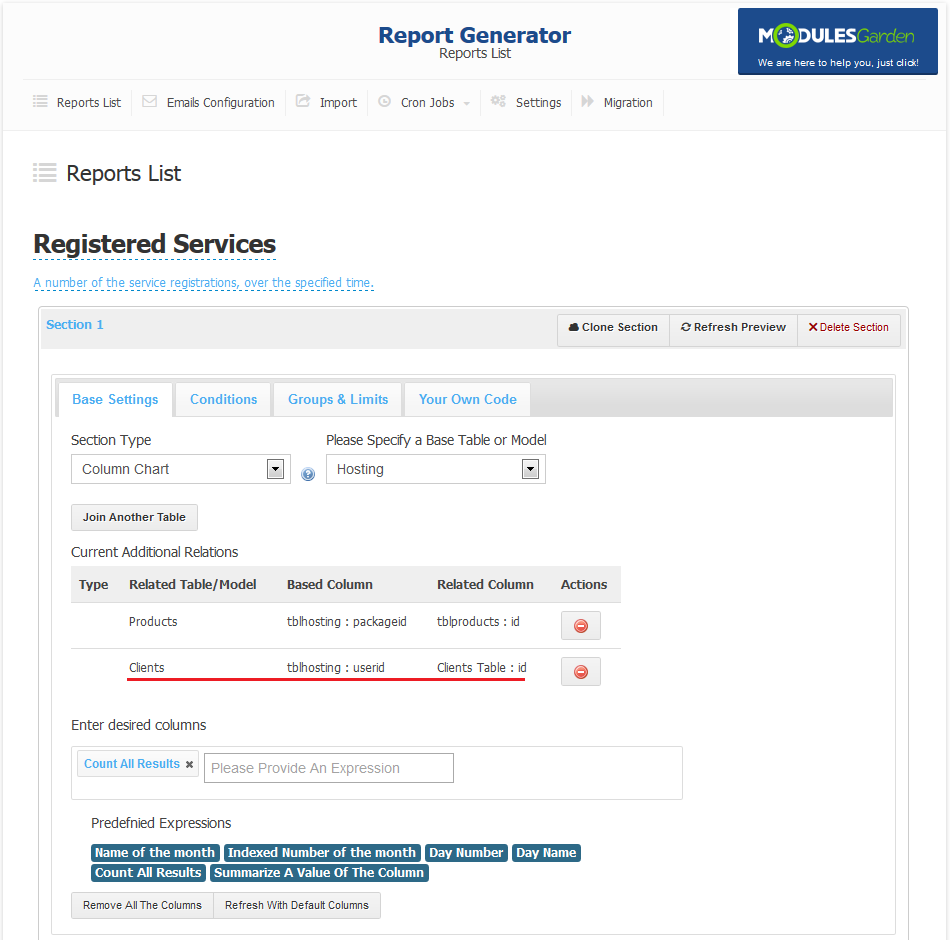
| Edit screen is the same as generate screen. Therefore you are allowed to modify and even entirely change report according to your needs. For this report we will add filtering results by clients' nationality. |
|
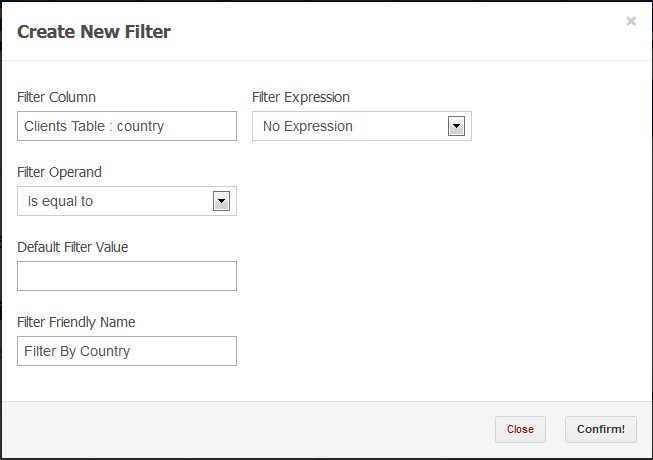
| Proceed to the 'Conditions' tab and press 'Add New Filter' . Filter set up shown on the following screen will filter report output depending of client's country. |
|
Email Configuration
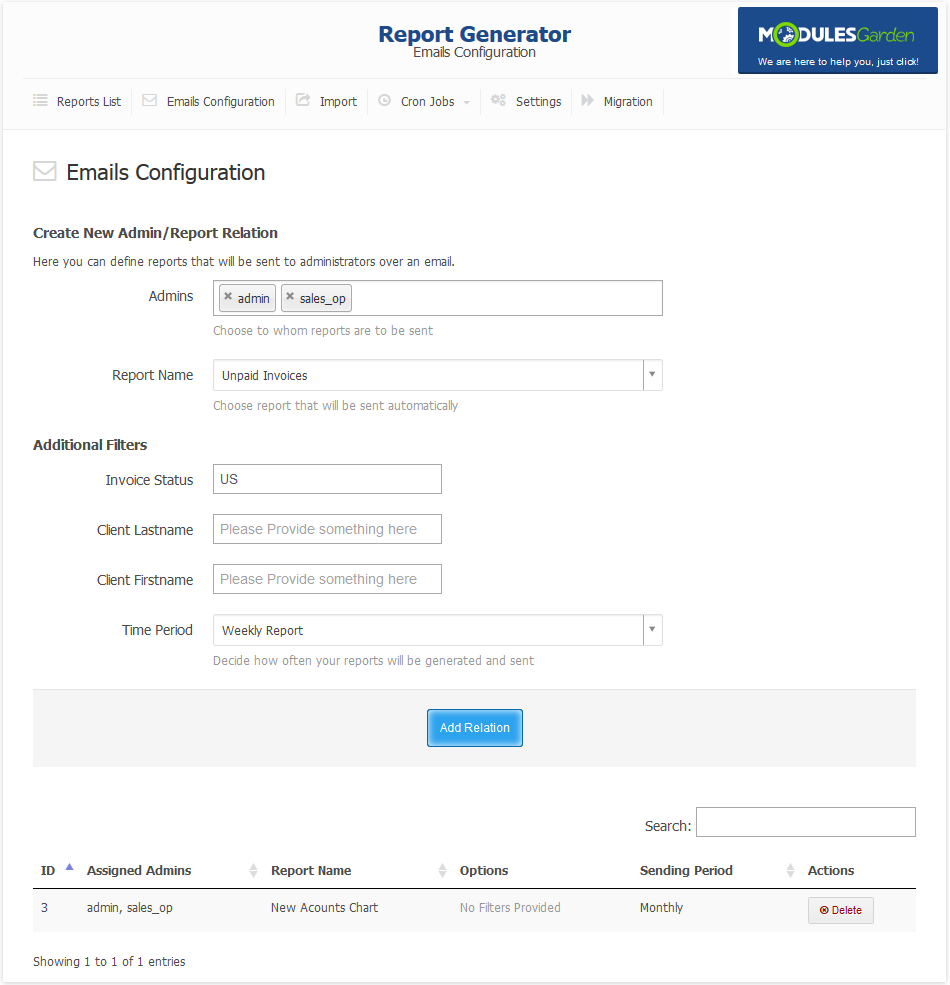
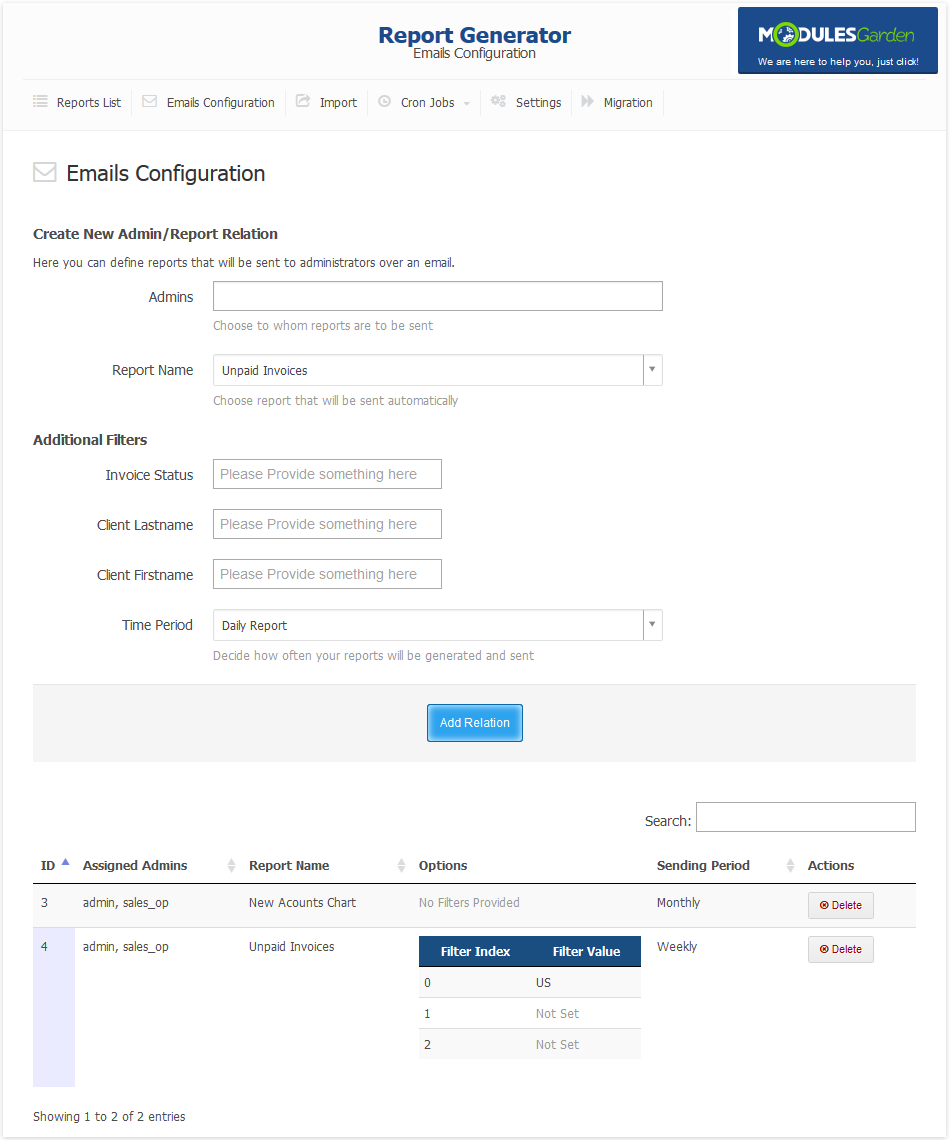
| At 'Email Configuration' you can set up emails with PDF reports sent to administrators. Start of selecting admin or admins to which email with report should be sent. |
|
| As you can see on the following screen, all relations are listed at the bottom of 'Email Configuration' page. Each of those relations can be removed at any time through pressing 'Delete' button. |
|
Import
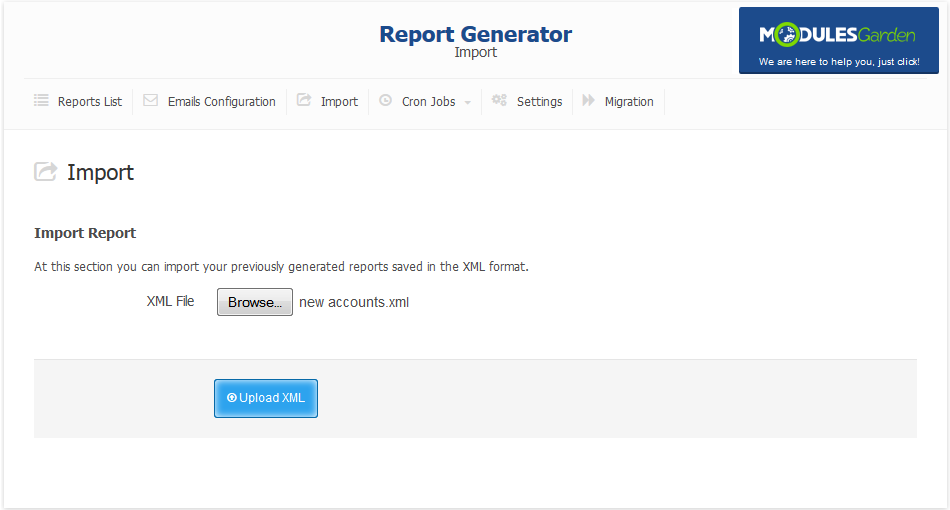
| To import report from the XML file into your Report Generator, go to the 'Import' tab. Press 'Browse' button and select your report XML file. |
|
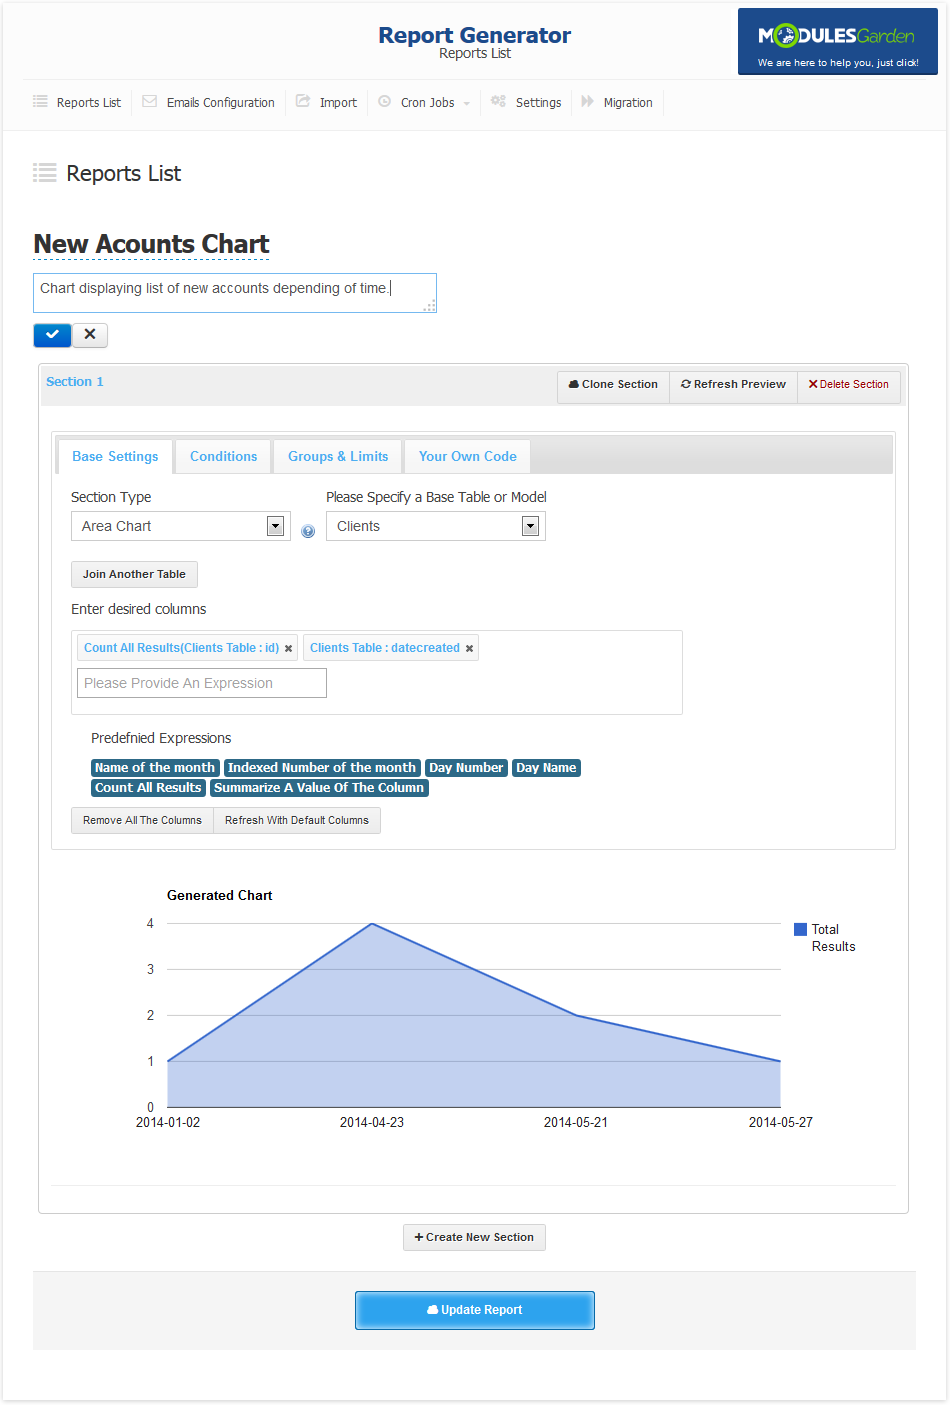
| Imported report should be renamed afterwards. Press 'Update Report' as soon as you finish. |
|
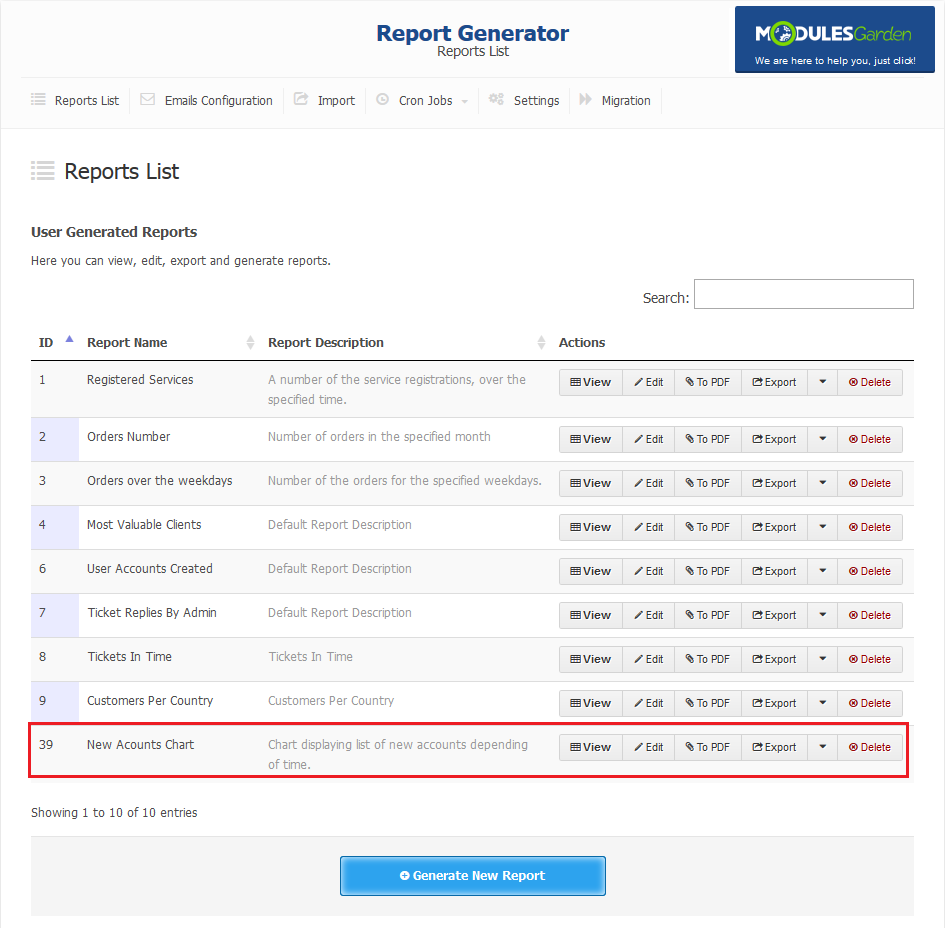
| Now you can go to the 'Reports List' to see that your report has been successfully imported and it is ready to use. |
|
Default Reports Settings
| At the 'Settings' → 'Default Reports Settings' tab you are allowed to define a few behaviors of our module. 1. Protects generating reports from data lost during refreshing. |
|
Tables And Columns Definitions
| Our module allows you to set up custom table and column names. It is very simple. Go to the 'Report Generator' → 'Settings' → 'Advanced Builder Settings' . As you can see, there are three text fields. |
|
Migration
| Due to changes in the module and its structure, upgrading it from version 1.0 requires migration tool. It can be accessed at the 'Migration' tab of our module and allows you to migrate reports from the previous version of Report Generator For WHMCS. |
|
| Afterwards, press 'Update Report' button. Your report is now available at the 'Reports List' → 'User Generated Reports' . |
|
Tips
| 1. In order to work properly, module requires PHP with a PDO support. |
| 2. There is workaround which enables you to copy report. Simply export report to XML structure and import report from a received file. |
Common Problems
| 1. When you have problems with connection, check whether your SELinux or firewall is not blocking ports. |
| 2. If you encounter any troubles with our module it is possible that you have not installed PDO. |