| Portainer Docker Containers For WHMCS is a powerful tool
|
| ✔ Set Failure Count To Trigger Notification
|
| ✔ Create Monitoring Checks For Allowed Services Within Specified Limits:
|
| ✔ Set Server Monitoring Check Limit
|
| ✔ Multi-Language Support With Custom Translations Tool
|
| ✔ Supports PHP 8.4 Back To PHP 8.1
|
| ✔ Supports WHMCS V8.13 Back To WHMCS V8.10
|
| ✔ Requires ionCube Loader V14 Or Later
|
Installation
This tutorial will show you how to successfully install and configure Portainer Docker Containers For WHMCS.
We will guide you step by step through the whole installation and configuration process.
|
| 1. Log in to our client area and download the module.
|
2. Extract the package and upload its content into the main WHMCS directory.
The content of the package to upload should look like this.
|
3. When you install Portainer Docker Containers For WHMCS for the first time you have to rename 'license_RENAME.php' file.
The file is located in 'modules/addons/PortainerDockerContainers/license_RENAME.php'. Rename it from 'license_RENAME.php' to 'license.php'.
|
4. In order to configure your license key, you have to edit the previously renamed 'license.php' file.
Enter your license key between quotation marks as presented on the following screen. You can find your license key in our client area → 'My Products'.
|
5. Now, set up the 'storage' folder as recursively writable.
This folder is available at '/yourWHMCS/modules/addons/PortainerDockerContainers/'.
|
5. Now you have to activate the module in your WHMCS system.
Log in to your WHMCS admin area. Go to 'System Settings' → 'Addon Modules'. Afterwards, find 'Portainer Docker Containers' and press the 'Activate' button.
|
6. In the next step, you need to permit access to this module.
To do so, click on the 'Configure' button, tick 'Full Administrator' and press 'Save Changes'.
|
8. You have just successfully installed Portainer Docker Containers For WHMCS!
You can access your module under 'Addons' → 'Portainer Docker Containers'.
Read the guide provided on the 'Dashboard' or continue with this documentation.
|
Management
Server Monitoring For WHMCS empowers your clients with tools to monitor their services directly from the WHMCS client area.
In this brief guide, we will introduce the module’s capabilities and show you how to make the most of its features.
|
Module Addon
| The module addon is where all of the setup and management take place for the admin.
It allows you to add products to the module, enabling the creation of checks for services associated with those products.
It also features several management tools like the queue, translations tool and module logs.
|
App Templates
'App Templates' allow you to manage and ultimately provide applications, ISO images, operating systems, and snapshots to your clients.
Prepare templates in the 'Applications' tab and gather them into groups in the 'Groups' tab.
For clients to be able to install templates on their VPS, their product has to include an 'Application Group' and allow 'App Templates' in the client area.
|
Applications
Read the guide carefully, as it contains crucial information on how to use 'App Templates'.
You can change the settings and have the guide collapsed by default. Clicking on the 'Additional Actions' button, select 'Options' and 'Collapse Guide'.
|
| You can switch between Applications, ISO Images, Operating Systems, and Snapshots by clicking on relevant tabs.
|
| You can use the refresh button to download and later refresh templates from the server.
|
Once the items are loaded, you can use the action buttons to edit, duplicate or delete them from the list.
You can also use the mass action buttons to manage multiple templates at once.
|
Groups
With the templates ready, all that is left is to gather them into groups and include said groups into products.
Navigate to 'App Templates' → 'Groups' and click on the 'Create' button.
|
Read the information, then provide the group with:
- Name
- Description
- Items to include
Note: Keep in mind that Vultr includes Windows licenses (Core and Standard) in their Plans and charges a monthly fee for them.
Since this will affect the Plan price, we recommend not including Windows with other systems in one product.
|
| You can use the action button and the mass action function to edit and delete groups.
|
For the client to take advantage of the application templates, the product module settings have to include the group.
Find the 'App Templates Configuration' section and 'Default Application Group' field.
Include a chosen group for the product.
|
| Make sure 'App Templates' section is enabled under 'Client Area Features'.
|
Advanced Configuration
| App templates allow for even more in-depth management with the ability to create and edit custom applications.
See the examples below to learn about the most important options.
|
Adding Applications Manually
Manually add a single application, instead of loading all your applications at once.
1. Navigate to 'App Templates' → 'Applications' and click on 'Create'.
|
| 2. Download the list of applications from you panel's API.
See the official official Vultr documentation too learn how.
Make sure to include your API Key, the request looks like this:
curl "https://api.vultr.com/v2/applications" \
 -X GET \
 -H "Authorization: Bearer ${VULTR_API_KEY}"
Example result:
{
"applications": [
{
"id": 1,
"name": "LEMP",
"short_name": "lemp",
"deploy_name": "LEMP on CentOS 6 x64",
"type": "one-click",
"vendor": "vultr",
"image_id": ""
}
|
| 3. In the 'Name' field we recommend including the value of the '"name": "$name"' field.
For example 'LEMP' from:
"name": "LEMP",
Note: If you include a 'name' setting detail (see step 4) with the name from the request as its value, you can safely rename the application to something else here.
|
| 4. Edit your newly added application, and under 'Settings Details' edit/create application details outputted by the panel's API.
|
| Carefully look at the API output and fill out the 'Name' and 'Default Value' fields with you application details.
In our case it is:
"id": 1,
|
| Add the remaining settings following the same pattern of filling the 'Name' and 'Default Value' fields.
|
| The application will be available on the list and ready to be included in a group.
|
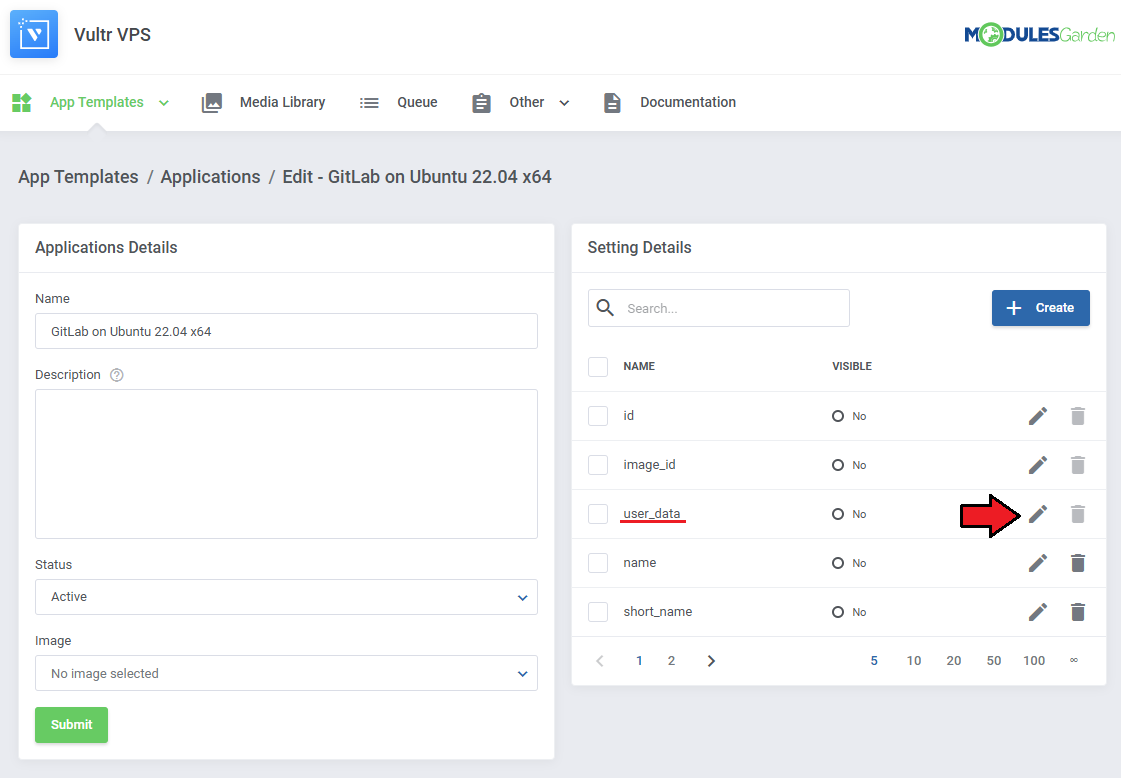
Including Cloud-Init / User-Data Scripts
Enter the user data to run common configuration tasks when the instance starts. You can run cloud-init directives or shell scripts for Linux images. You may use smarty variables, e.g. {$password}.
Note: Please refer to the following article to find a list of supported module parameters and their descriptions.
If an application supports scripts, the responsible setting will always be added automatically.
To include a script, edit the setting by clicking on the 'Edit' button next to it.
|
|
See the list below to learn how to set up the setting.
- Name - do not change this value, this is the setting identifier.
- Field Type - if the 'Visibility' setting is toggled on, this field decides the type of field, we recommend leaving it as is.
- Default Value - this is where you include your script. If 'Visibility' is toggled on, this will be the default value that clients can modify.
Note: Use the merge field list on the right for reference.
- Validation - optionally, provide Laravel validation rules like 'required'.
- Visibility - this will allow the client to modify the script before installation.
|
| If the 'Visibility' toggle is on, the script will be accessible before the installation, if not, the script will just be performed as normal.
|
Media Library
The media library allows you to upload images for use elsewhere in the module by admins and clients.
To upload a new picture, click on the 'Upload Image' button.
|
You can delete images one by one by clicking on them.
To delete all images at once, use the additional action button.
|
{
|style="padding: 10px 0px 15px 15px;"|Customizing language files is now extremely easy with the "Translations" tool that is now available directly in the addon.
Its user-friendly design makes managing various language file tweaks a smooth and efficient process.
Prepare translations for the original English files with this handy built-in tool. For specific instructions on how to use this tool please refer to its dedicated article, you will find it here.
|}
Logs
The 'Logs' section under the 'Other' tab is where the module logs are stored.
You can filter the module logs by type with the 'Show' buttons:
- Critical
- Error
- Notice
- All (Total)
|
| You can delete logs either one by one or with the mass delete function.
|
Additional actions include:
- Logging Settings
- Log Export
- Rule Based Deletion
|
In the settings you may decide:
- Log Types - Specify which types of logs should be recorded.
- Clear Automatically - Choose whether to automatically delete logs older than a defined number of days.
- Delete Logs Older Than - Define the number of days after which logs will be automatically deleted.
|
While exporting you will have to specify which logs to export:
- From - Define the starting date for logs to export.
- To - Define the ending date for logs to export.
- Log Types - Includes 'Notice', 'Error' and 'Critical' log types.
|
You can also delete specific logs without finding them manually.
Simply define:
- Log Types - Specify which log types should be considered for removal.
- Delete Logs Older Than - Define the number of days after the log occurrence for automatic deletion.
|
The "Logs" tool makes monitoring and managing module activity records simple and efficient. It provides options to categorize, filter, and view detailed entries, giving you control over the logs.
Features like bulk deletion, rule-based deletion, and export options make it easy to organize and maintain your logs.
For detailed guidance on using this tool, check its dedicated article, which is available here.
|
Dashboard
| The 'Dashboard' provides information and statistics related to the functions of the module.
At the top, you will find a condensed setup guide, presenting the same information as this documentation.
|
| After familiarizing yourself with the guide, you can opt to hide it under 'Additional Actions' → 'Settings'.
|
| Monitor total check successes and failures over time with the line graph.
|
All check successes and failures are counted across different categories:
- Check Results from the Last 24 Hours
- Check Results from the Last 7 Days
- Check Results from the Last 30 Days
- Total Check Results
|
The most recent checks are listed in the 'Recently Performed Checks' table, the information includes:
- Check ID
- Check Name
- Related Service
- Check Type
- Status
|
Client Area
Clients will be able to take advantage of Server Monitoring For WHMCS too, as long as they own one of the products you have configured.
The basic client area integration allows them to create and monitor checks for their service, within restrictions opposed by the admin.
To add a new check, click on the 'Create Check' button.
|
Fill out the necessary fields:
- Name - provide a name for the check.
- Status - set the initial status of the check, it can be toggled off and on later as well.
- Verification Interval - set how often the check should be performed (in minutes).
- Failure Count for Notification - set how many checks with the failed verification are needed to send a notification.
- Type of Performed Check - select the type of the check.
- IP Address - select/provide an IP address to be checked.
- Notification Type - select the type of the notification.
- Notification Recipients - select where the notification should be sent.
|
| Once the check is added, you can toggle it on/off as needed with the 'Status' toggle.
|
| You can display logs for the specific check by clicking on the 'Show Logs' button.
|
| The logs only include results of the selected check, as opposed to all logs in the table below.
|
Use the action buttons to edit or delete created checks whenever you need to.
Consider disabling a check with the 'Status' toggle before deleting it for good.
|
The 'Server Monitoring Logs' list check history of every check related to the service in a single table including:
- Check Name
- Check Type
- Check Result
- Check Date
|
| A graph with check results over time will be drawn for the service as well, provided the function has been enabled.
|
Tips
1. If you plan on using the 'Socket Ping Check' check type, make sure that queue executor cron has admin permissions.
You can do this by running it from an account with sudo permissions or adding 'sudo' before the cron job line like this: sudo php -q /your_whmcs/modules/addons/ServerMonitoring/cron/cron.php checks:run
|
2. Use the Configurable Option below to enable module features in the client area for the selected service. This option can also be utilized to include additional charges if needed.
Note: Products still have to be added in the module addon.
serverMonitoring|Server Monitoring Tool
|
3. Use the Configurable Option below to allow clients to select their preferred checks limit during the ordering process. You may also configure pricing based on the selected limit.
serverMonitoringChecksLimit|Checks Limit
|
Update Instructions
An essential guidance through the process of updating the module is offered here.
Ensure successful completion of the module update by carefully following each step, thereby preventing data loss or any unforeseen issues.
Additionally, you will find a current list of supplementary actions necessary for a smooth update process there.
|
Upgrade Guide
Seeking a solution that offers greater flexibility, customization tailored to your precise needs, and unrestricted availability?
There is an option that not only proves to be cost-effective in the long run but also includes prioritized support services, making it a truly valuable investment.
Opt for the Open Source version of your Server Monitoring For WHMCS module to unlock these benefits.
Simply click on either the Get Source Code or Upgrade To Lifetime button found on the product's page in our client area to complete the one-step upgrade process, with a dedicated discount already applied.
Follow a comprehensive guide covering the transition process, the advantages it brings, and step-by-step instructions on what to do next after the order has been successfully finalized.
|
Common Problems
| 1. When you have problems with connection, check whether your SELinux or firewall does not block ports.
|


