Server Monitoring For WHMCS
m (→About Server Monitoring For WHMCS) |
(→Checks) |
||
| Line 165: | Line 165: | ||
===Checks=== | ===Checks=== | ||
{| | {| | ||
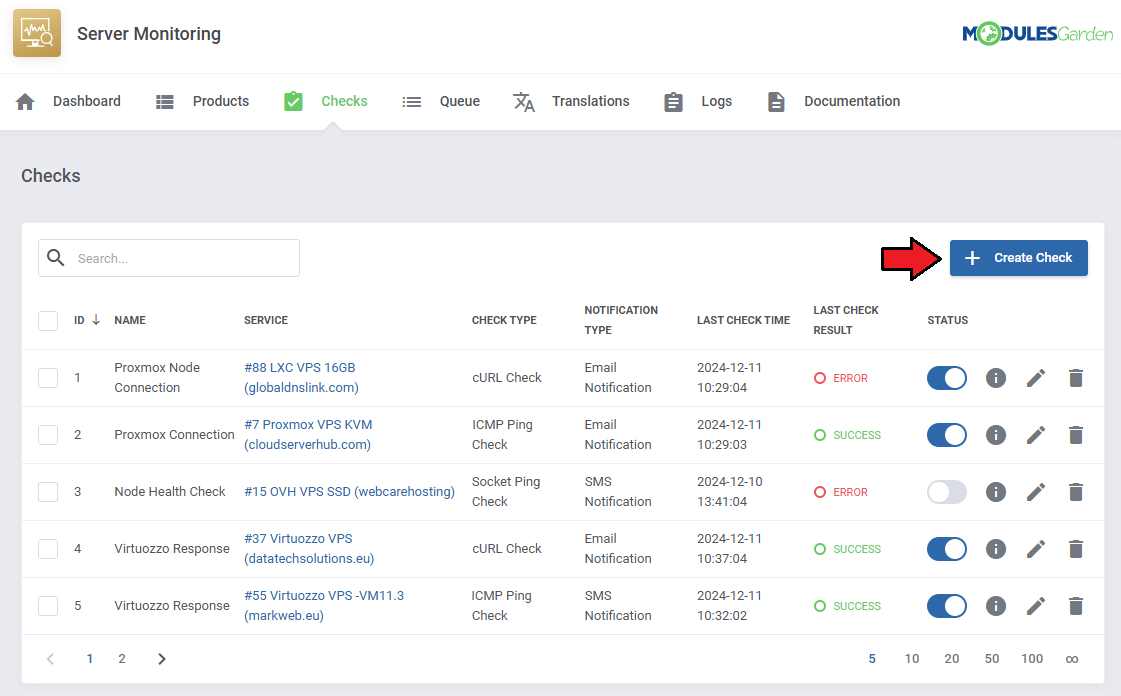
| − | |style="padding: 10px 0px 15px 15px;"| | + | |style="padding: 10px 0px 15px 15px;"|Once products are added, both admins and clients can create checks for services.<br/> |
| + | To see how clients can add and monitor checks for their services see the [[Client_Area|Client Area]] section.<br/> | ||
| + | To add checks as an admin, navigate to the '' 'Checks' '' section of the module and click on the '' 'Create Check' '' button. | ||
|} | |} | ||
{| | {| | ||
| Line 171: | Line 173: | ||
|} | |} | ||
{| | {| | ||
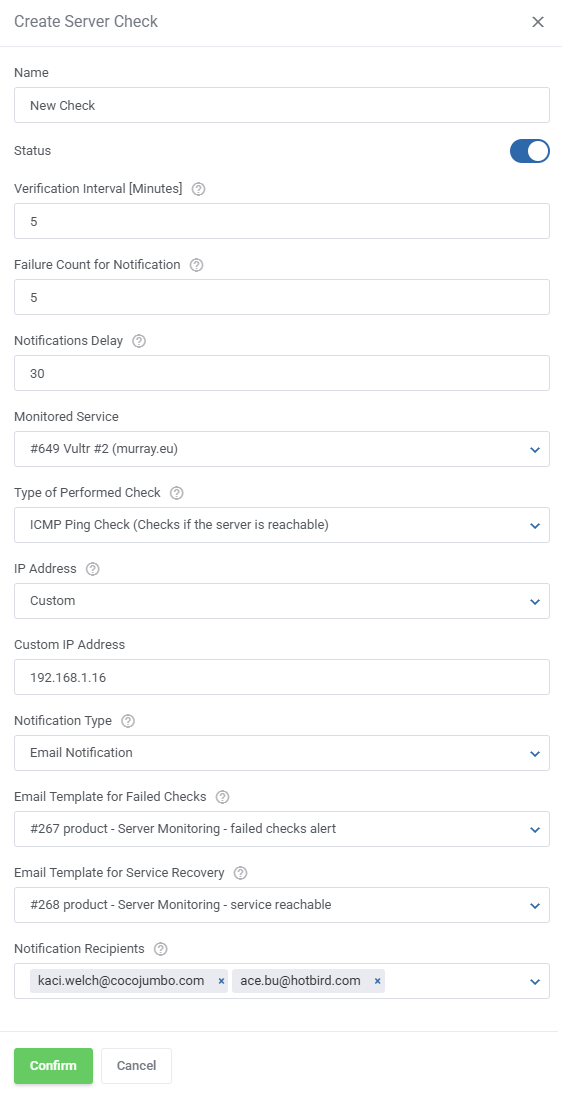
| − | |style="padding: 0px 0px 15px 15px;"| | + | |style="padding: 0px 0px 15px 15px;"|Provide the required fields: |
| + | *'''Name''' - provide a name for the check. | ||
| + | *'''Status''' - select the initial status of the check, this can be changed later. | ||
| + | *'''Verification Interval''' - decide how often the check should be performed (in minutes). | ||
| + | *'''Failure Count For Notification''' - indicate how many checks need to fail before a notification is sent. | ||
| + | *'''Monitored Service''' - select the service that will be checked. | ||
| + | *'''Type of Performed Check''' - pick the check type. | ||
| + | *'''Request URL''' - provide a URL that will return a code upon a GET request. | ||
| + | *'''Response Code''' - include the expected HTTP response code. | ||
| + | *'''IP Address''' - provide the IP address for the check. | ||
| + | *'''Notification Type''' - select the notification type. | ||
| + | *'''Email Template for Failed Checks''' - decide which email template will be used when the failure count is exceeded. | ||
| + | *'''Email Template for Service Recovery''' - decide which email template will be used when the service has recovered. | ||
| + | *'''Notification Recipients''' - select where to sent the notification. | ||
| + | *''' | ||
| + | |||
|} | |} | ||
{| | {| | ||
| Line 177: | Line 194: | ||
|} | |} | ||
{| | {| | ||
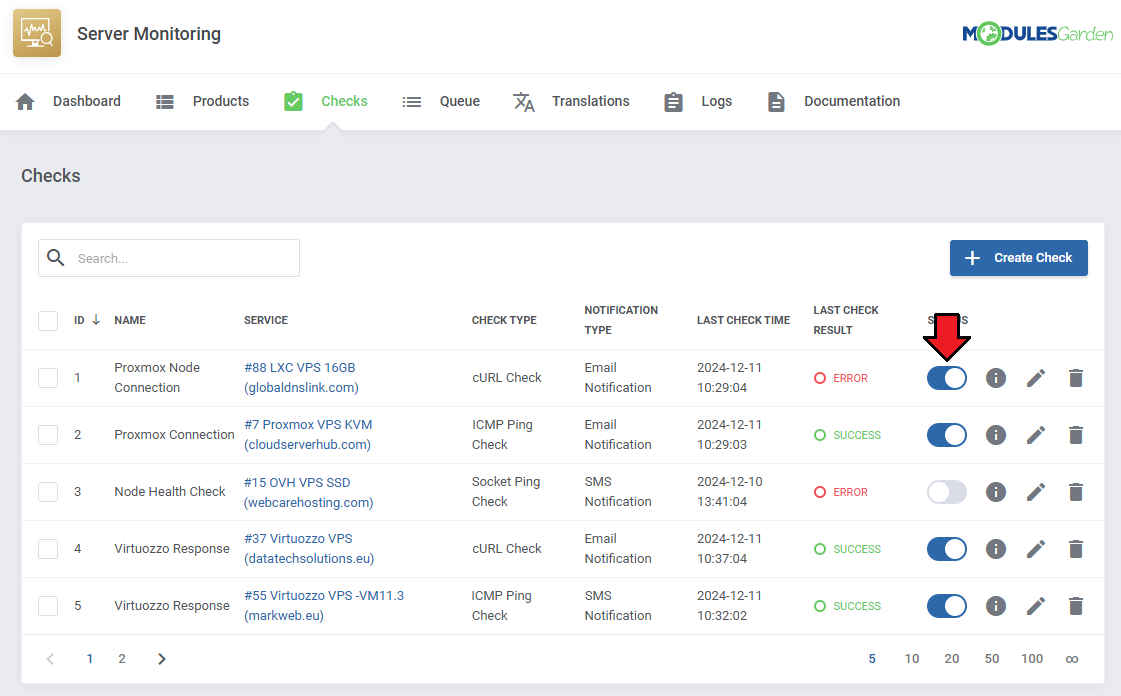
| − | |style="padding: 0px 0px | + | |style="padding: 0px 0px 20px 15px;"|Once checks are added, you can turn them off and on with the '' 'Status' '' toggle. |
|} | |} | ||
{| | {| | ||
| Line 183: | Line 200: | ||
|} | |} | ||
{| | {| | ||
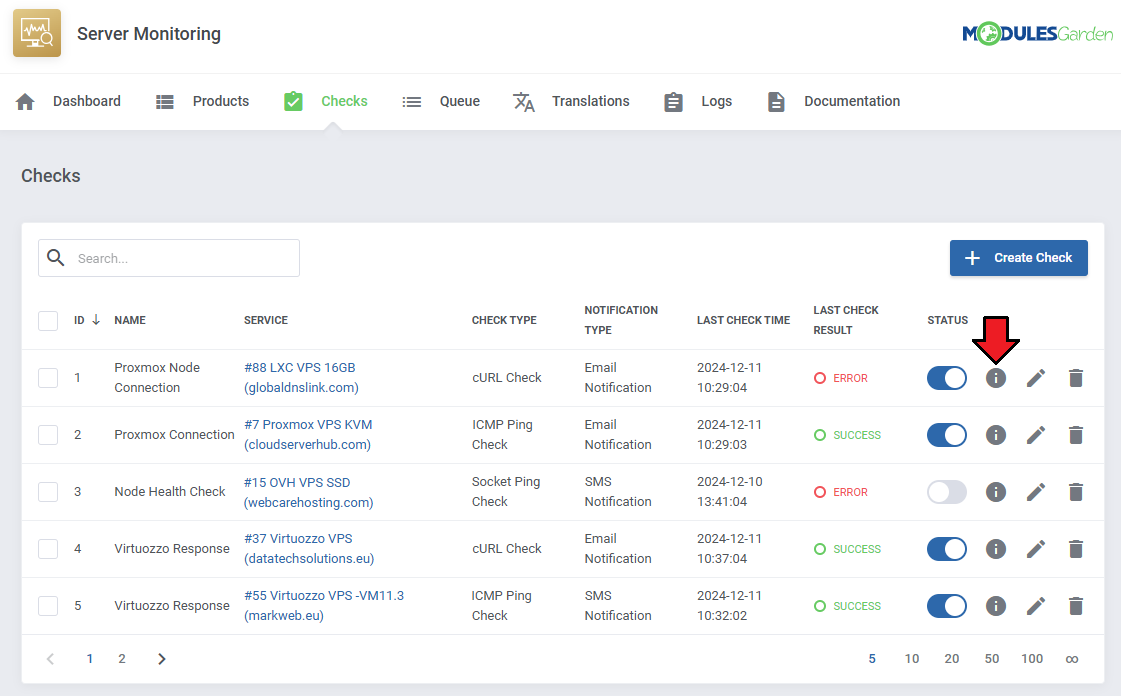
| − | |style="padding: 0px 0px | + | |style="padding: 0px 0px 20px 15px;"|Click the '' 'Show Logs' '' button to display logs related to the specific check. |
|} | |} | ||
{| | {| | ||
| Line 189: | Line 206: | ||
|} | |} | ||
{| | {| | ||
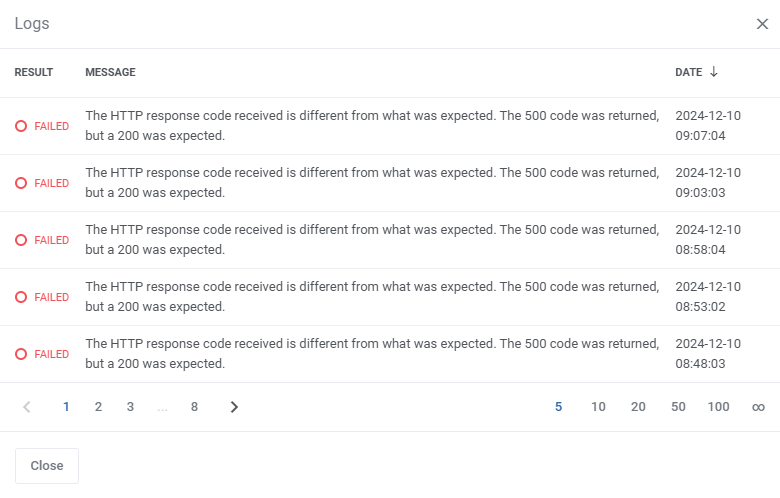
| − | |style="padding: 0px 0px | + | |style="padding: 0px 0px 20px 15px;"|The logs will include: |
| + | *The result of the check | ||
| + | *Its message | ||
| + | *Its date. | ||
| + | Note that clients will not be able to see messages when checking logs in the client area. | ||
|} | |} | ||
{| | {| | ||
| Line 195: | Line 216: | ||
|} | |} | ||
{| | {| | ||
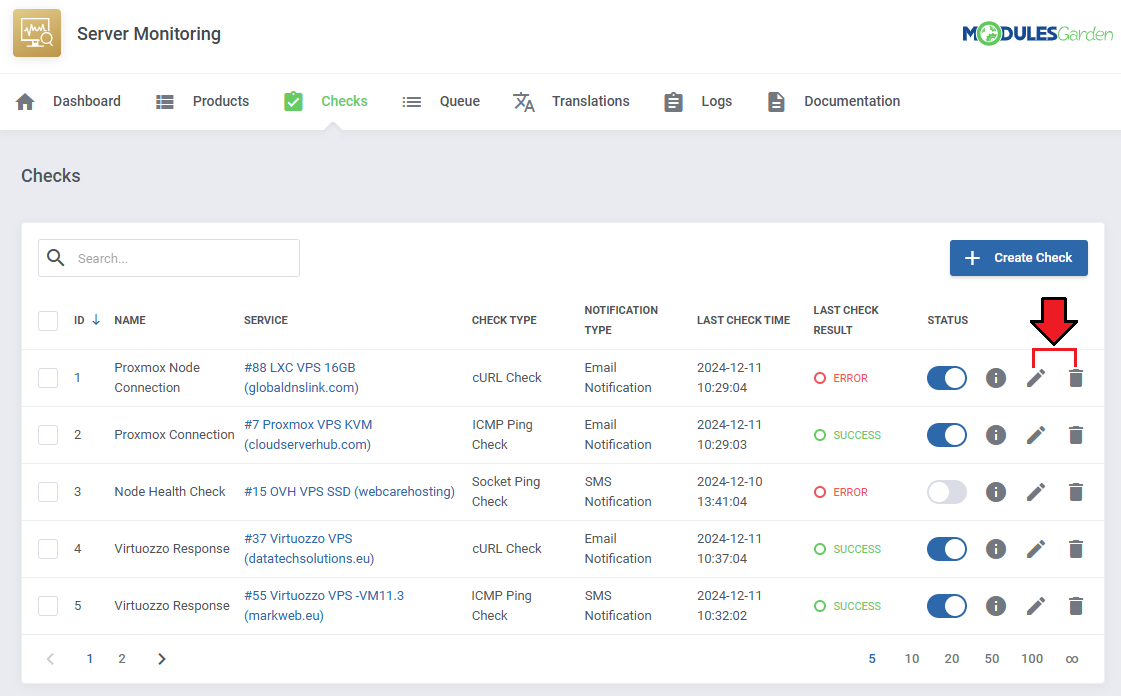
| − | |style="padding: 0px 0px | + | |style="padding: 0px 0px 20px 15px;"|Use the action buttons to edit or delete checks as needed. |
|} | |} | ||
{| | {| | ||
| Line 201: | Line 222: | ||
|} | |} | ||
{| | {| | ||
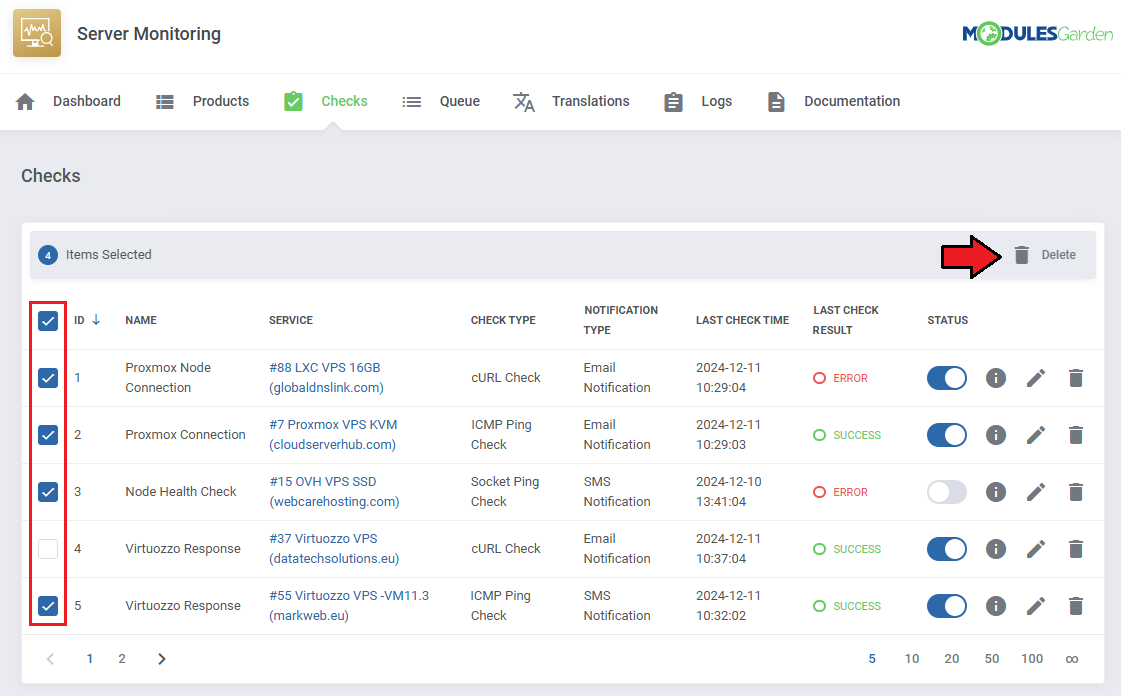
| − | |style="padding: 0px 0px | + | |style="padding: 0px 0px 20px 15px;"|The mass action function can be used to delete multiple checks at once. |
|} | |} | ||
{| | {| | ||
Revision as of 13:40, 11 December 2024
Contents |
About Server Monitoring For WHMCS
| Server Monitoring For WHMCS is a powerful tool designed for administrators and their clients, enabling fast and effective verification of server online status through ping and HTTP checks. Schedule regular checks on VPS services, giving your clients the ability to configure and monitor their checks, and helping them track the health of their services within predefined limits and intervals. Establish continuous control of server health and empower your customers to monitor the performance of their services. |
- Addon Module Features:
| ✔ AAA |
| ✔ AAA |
- General Info:
| ✔ Multi-Language Support With Custom Translations Tool |
| ✔ Supports PHP 8.2 Back To PHP 8.1 |
| ✔ Supports WHMCS Themes "Six" And "Twenty-One" |
| ✔ Supports WHMCS V8.11 Back To WHMCS V8.8 |
| ✔ Requires ionCube Loader V13 Or Later |
| ✔ Easy Module Upgrade To Open Source Version |
Installation
| This tutorial will show you how to successfully install and configure Server Monitoring For WHMCS. We will guide you step by step through the whole installation and configuration process. |
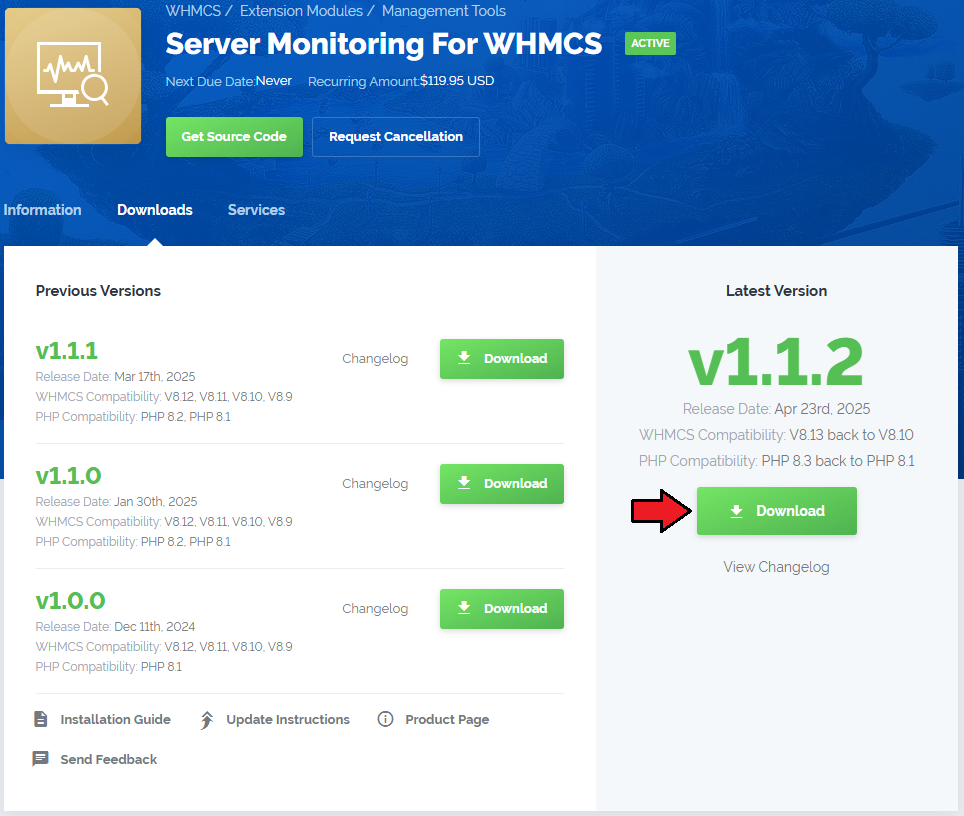
| 1. Log in to our client area and download the module. |
|
| 2. Extract the package and upload its content into the main WHMCS directory. The content of the package to upload should look like this. |

|
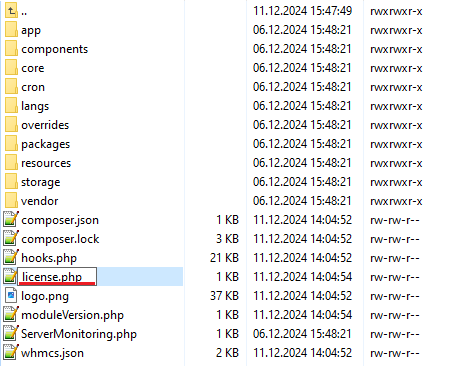
| 3. When you install Server Monitoring For WHMCS for the first time you have to rename 'license_RENAME.php' file. The file is located in 'modules/addons/ServerMonitoring/license_RENAME.php'. Rename it from 'license_RENAME.php' to 'license.php'. |
|
| 4. In order to configure your license key, you have to edit the previously renamed 'license.php' file. Enter your license key between quotation marks as presented on the following screen. You can find your license key in our client area → 'My Products'. |

|
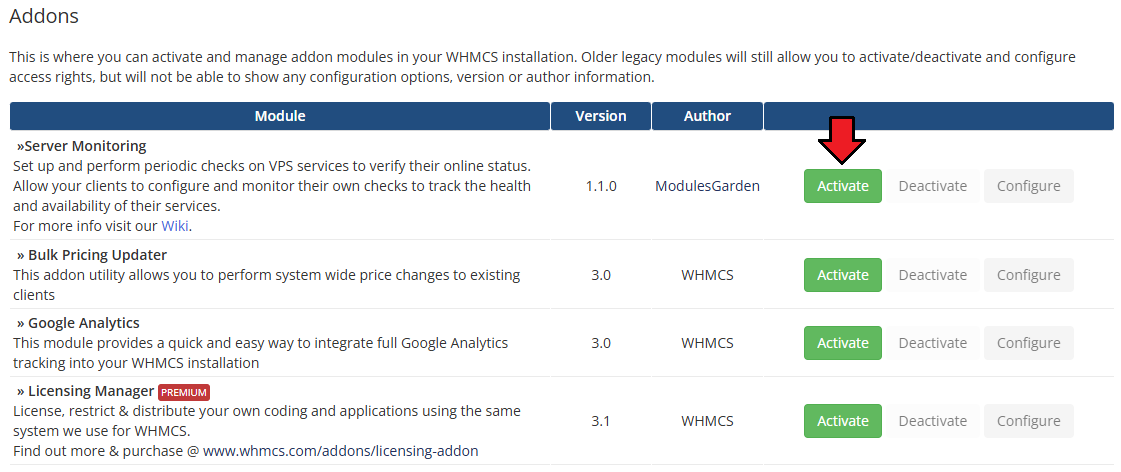
| 5. Now you have to activate the module in your WHMCS system. Log in to your WHMCS admin area. Go to 'System Settings' → 'Addon Modules'. Afterwards, find 'Marketing Triggers Automation' and press the 'Activate' button. |
|
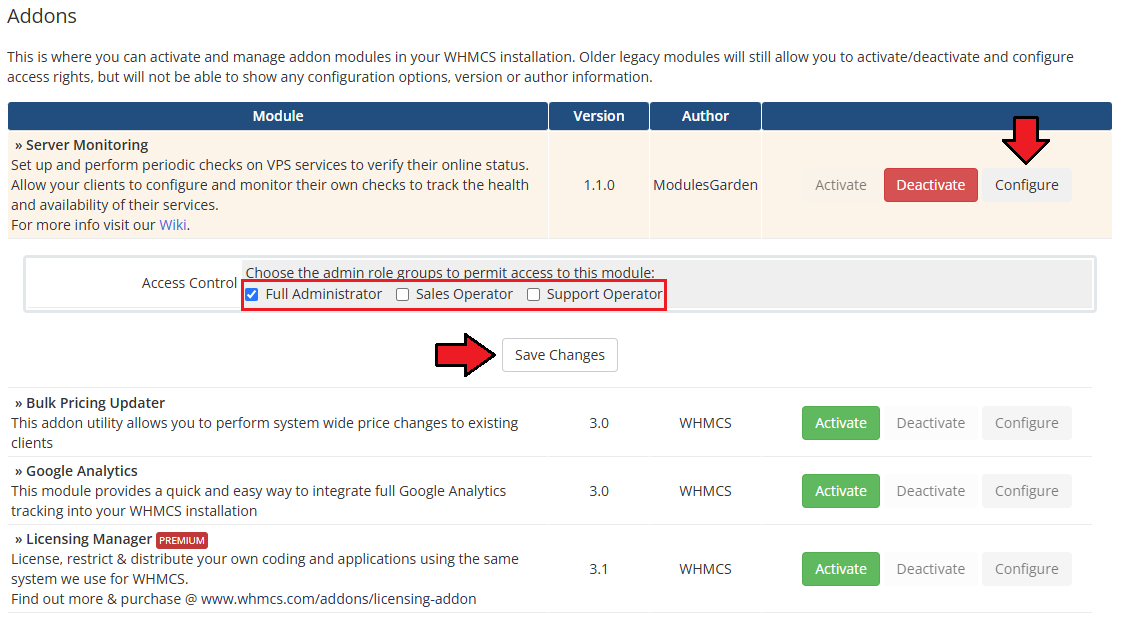
| 6. In the next step, you need to permit access to this module. To do so, click on the 'Configure' button, tick 'Full Administrator' and press 'Save Changes'. |
|
7. The final step of the module installation is setting up a cron command that is required for several module features to work properly.
php -q /yourWHMCS/modules/addons/Server Monitoring/cron/cron.php actions:run Note that the above directory is exemplary, please adjust the cron line to your own needs. A 5-minute interval is recommended. |
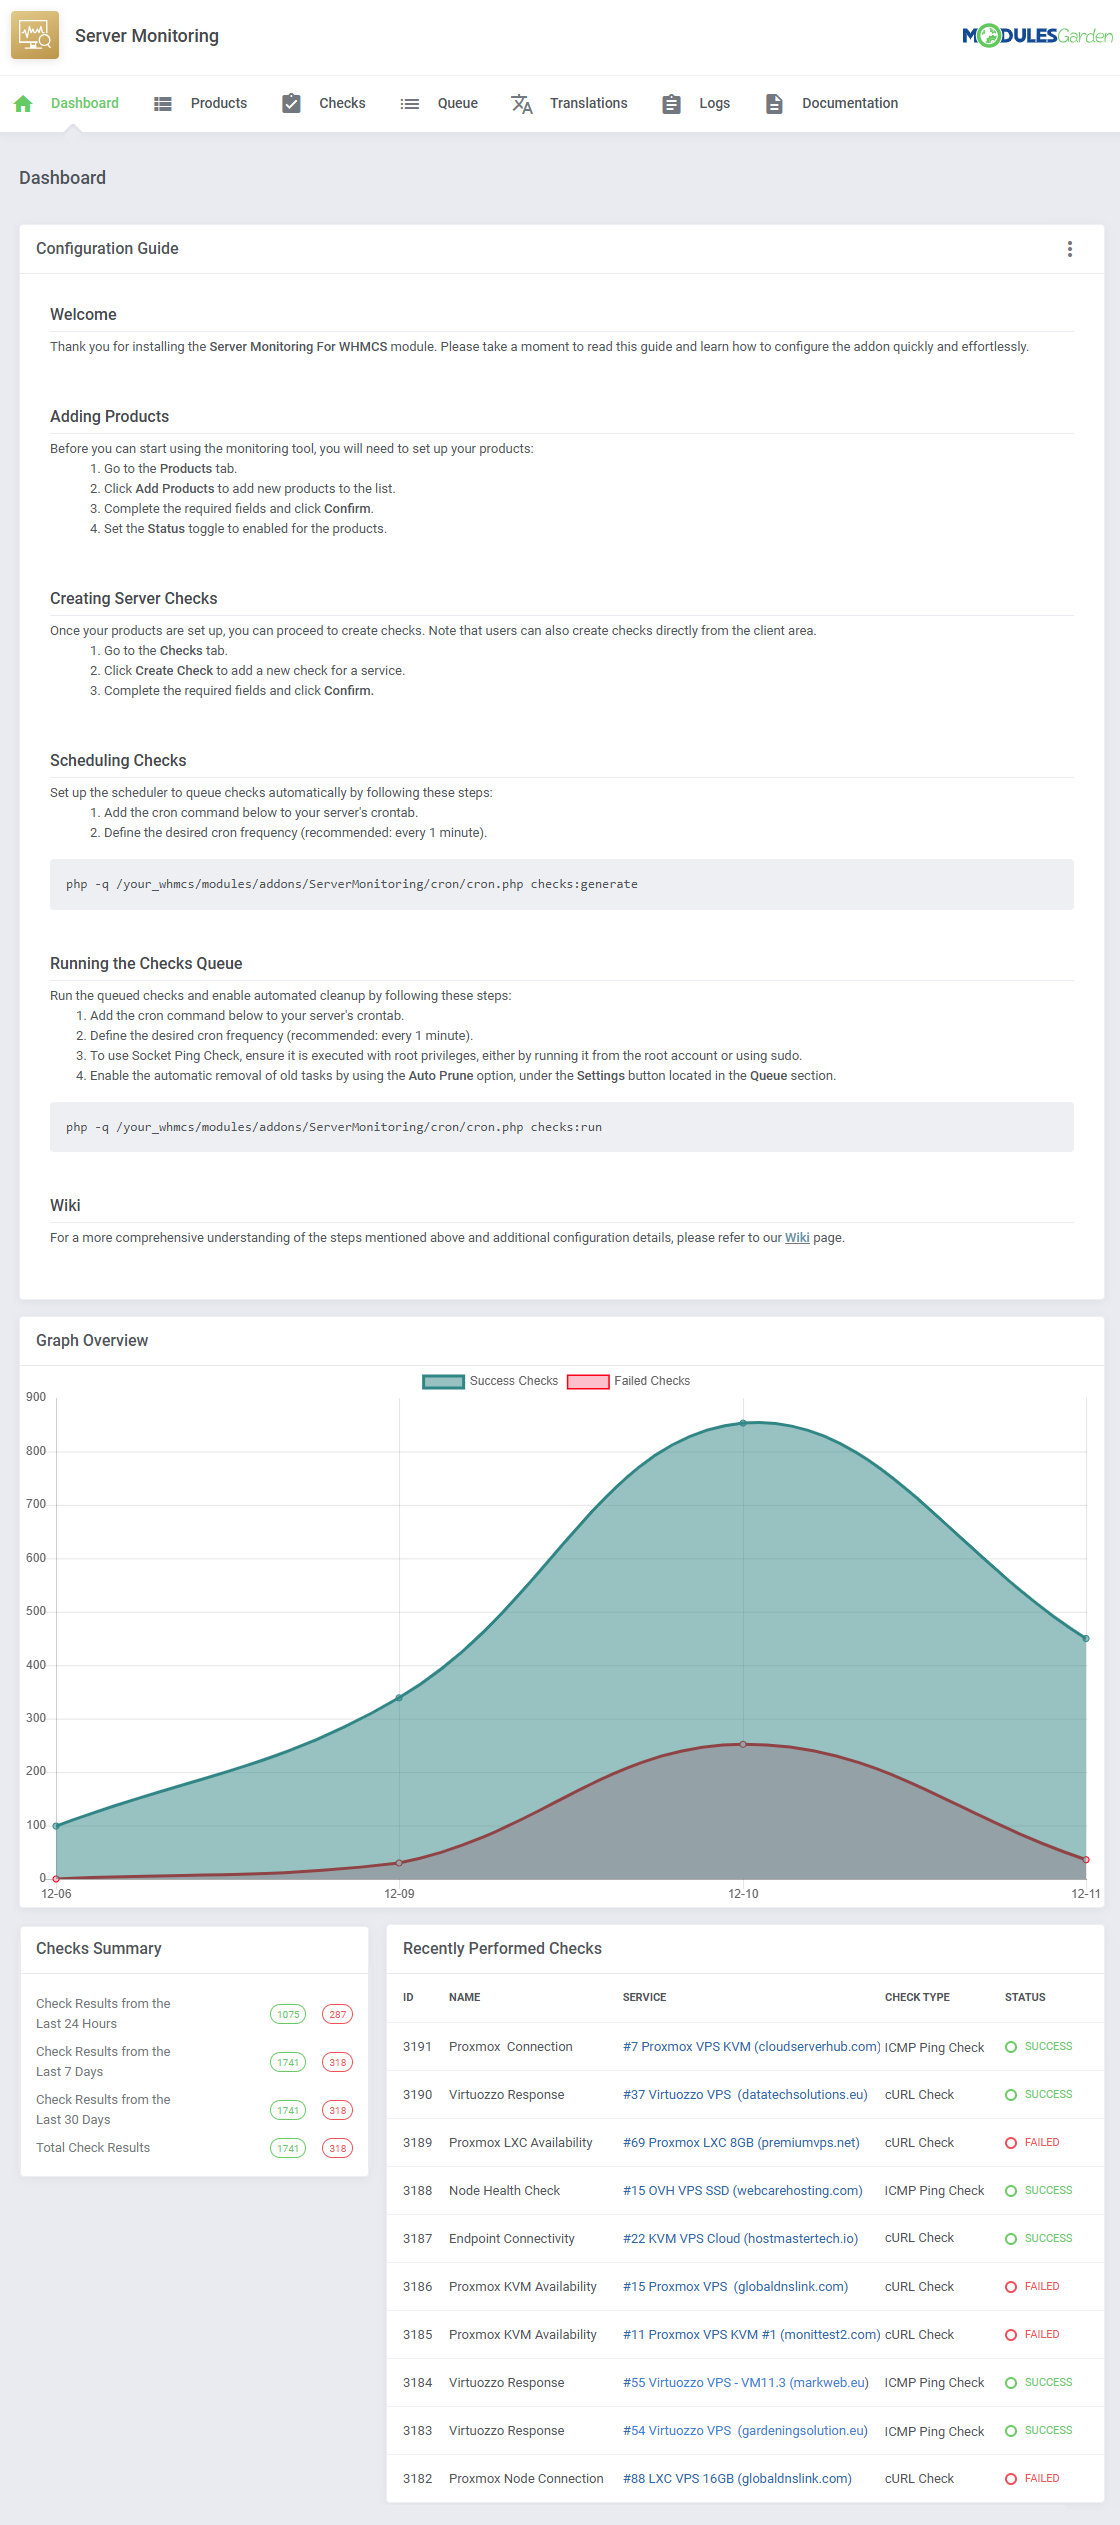
| 8. You have just successfully installed Server Monitoring For WHMCS! You can access your module under 'Addons' → 'Server Monitoring'. |
|
Management
| AAA |
Module Addon
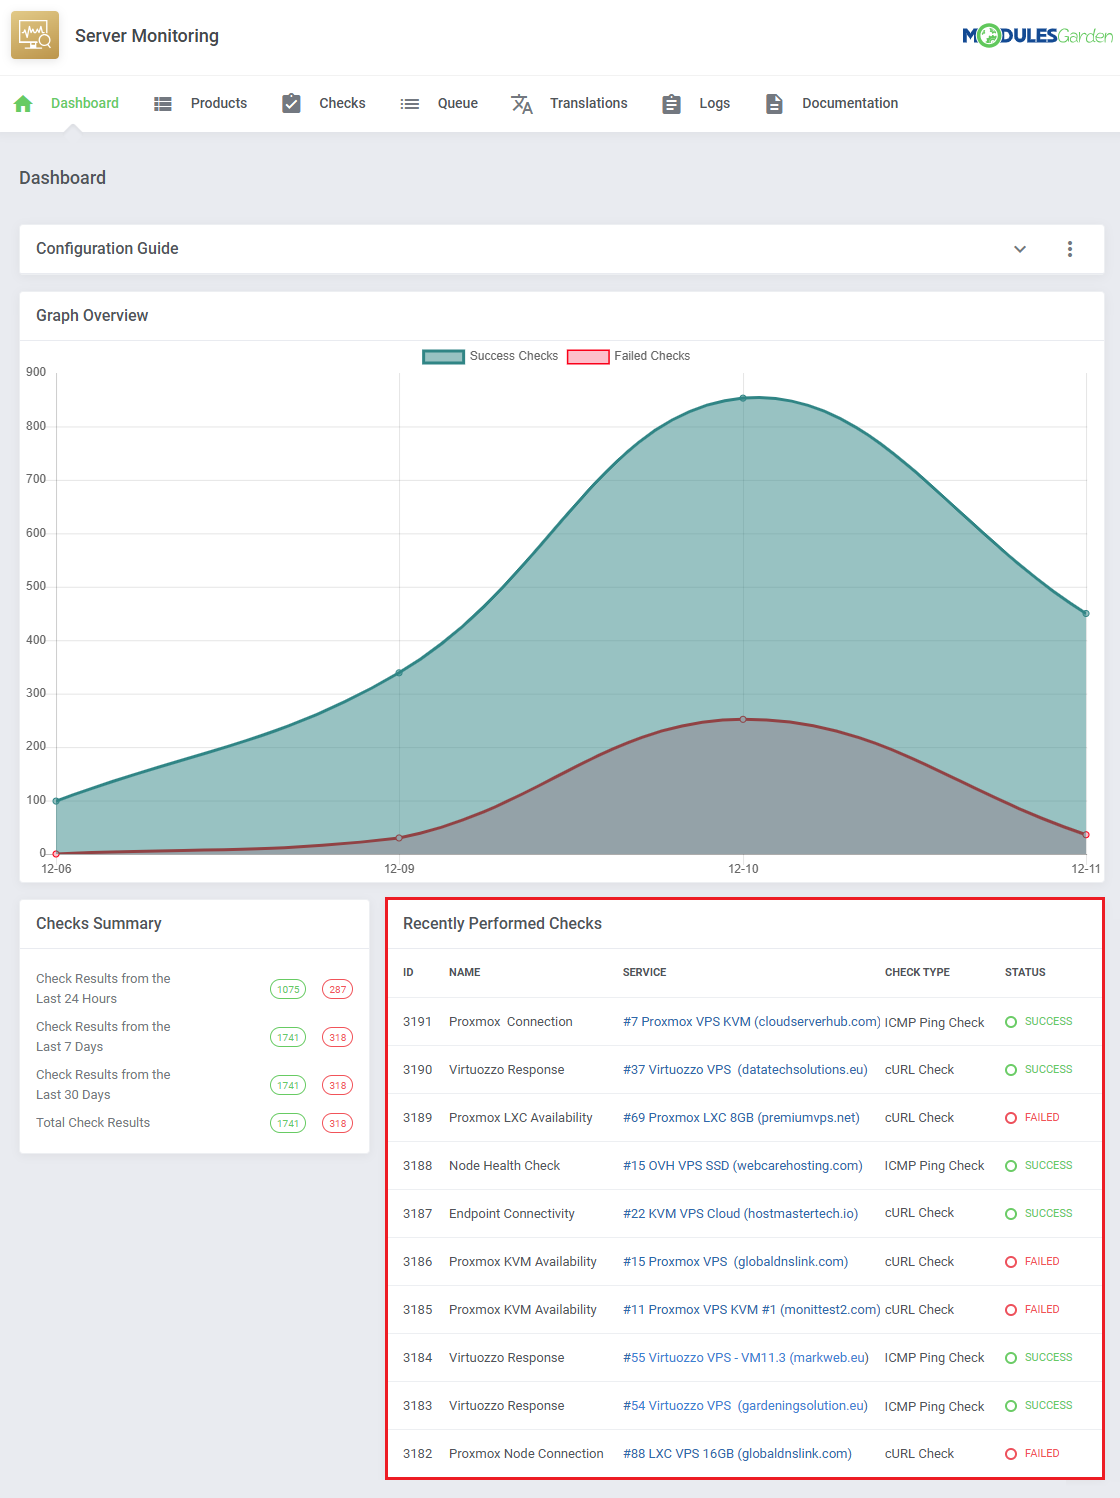
Dashboard
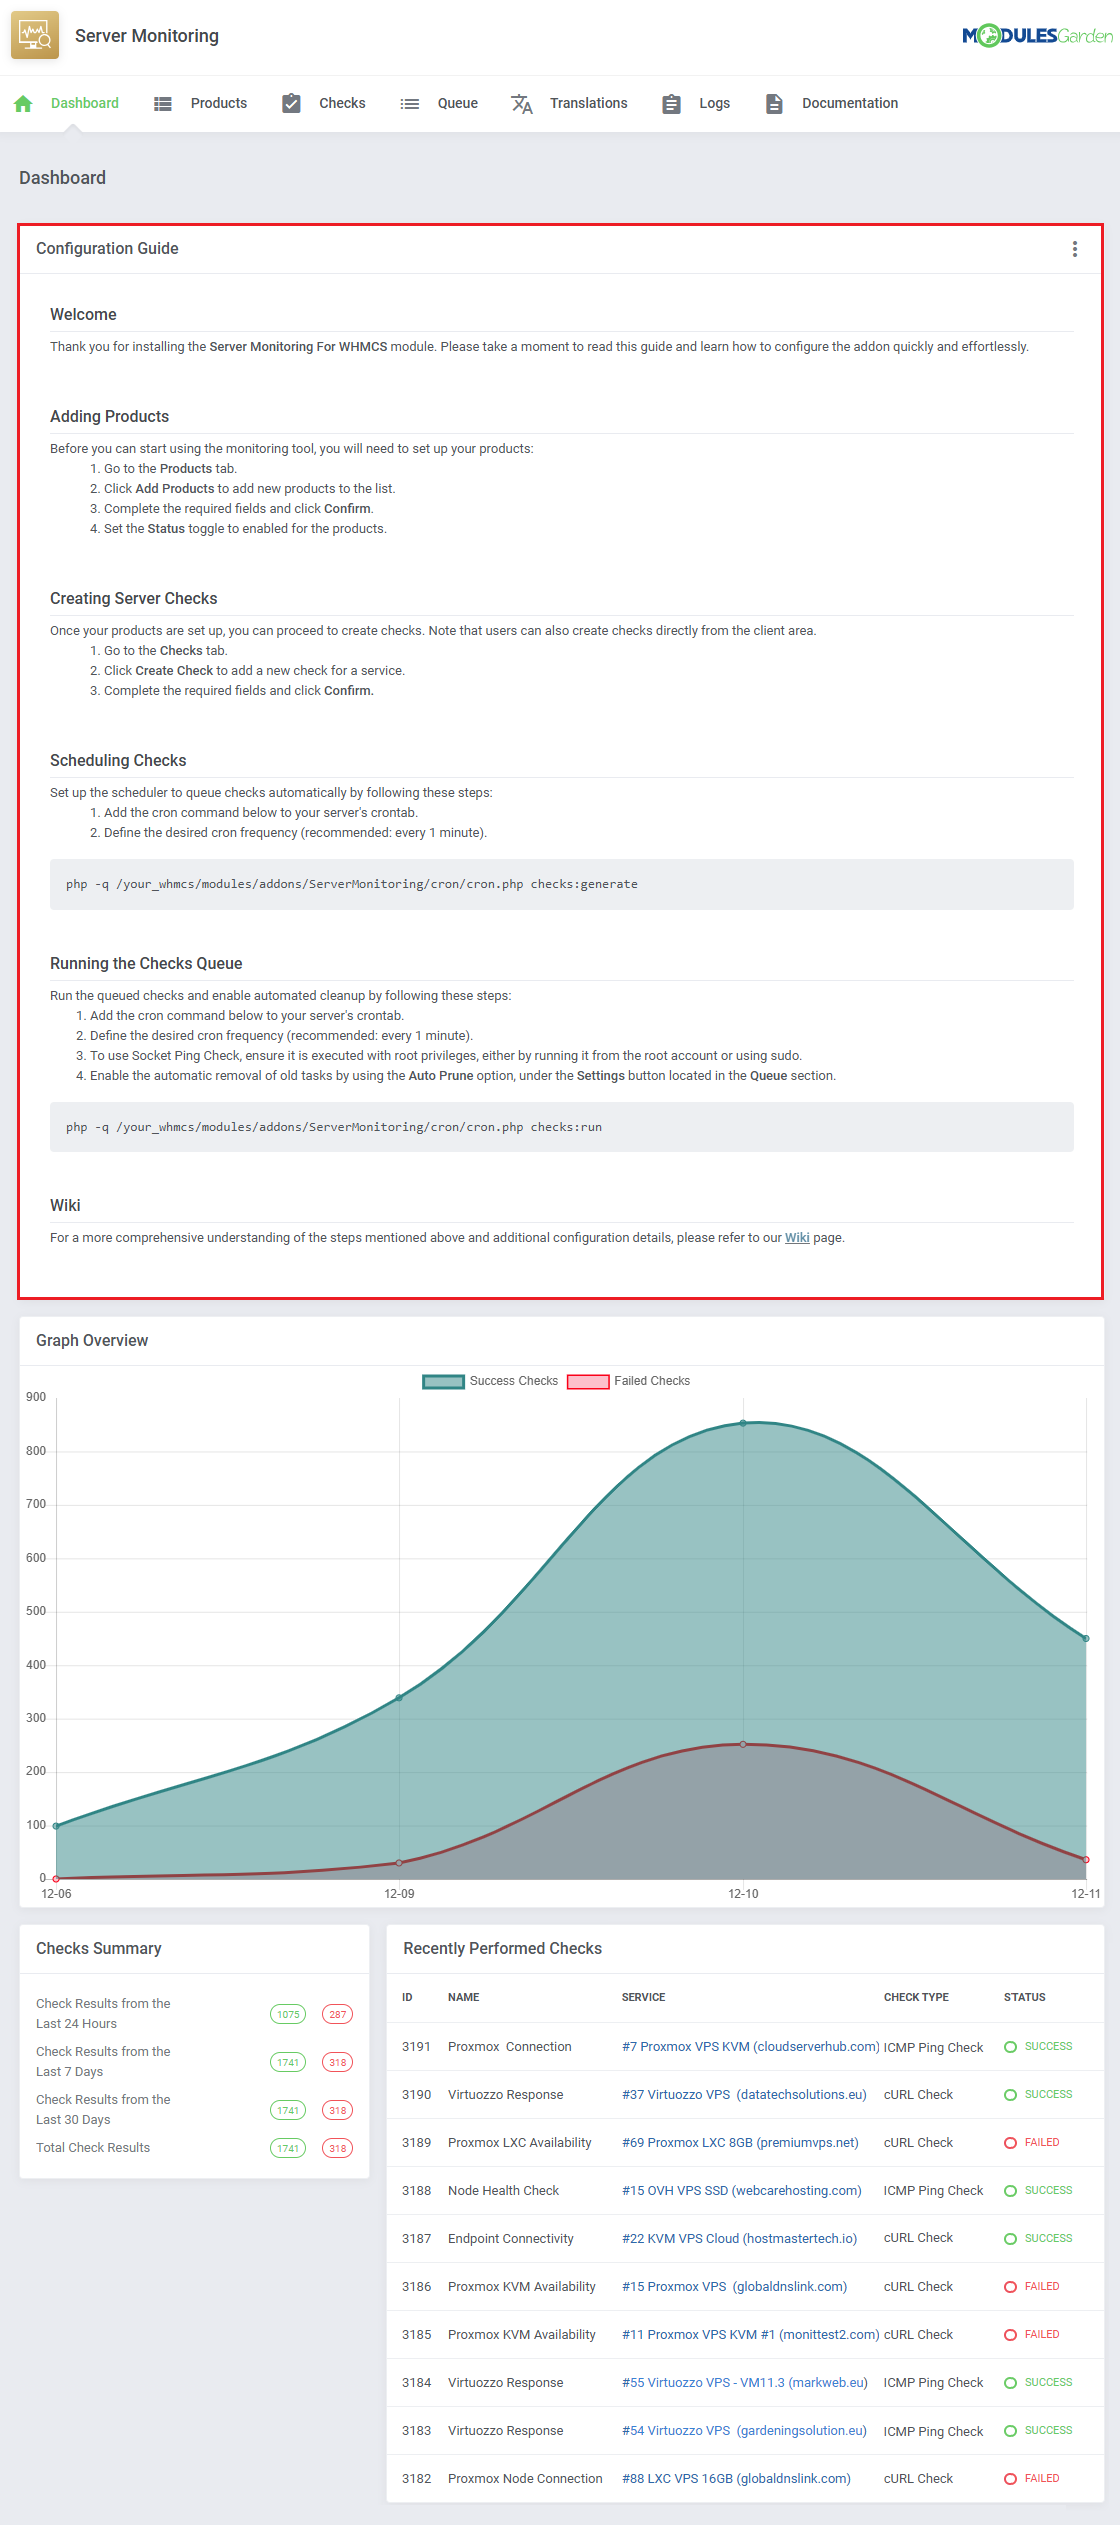
| Guide |
|
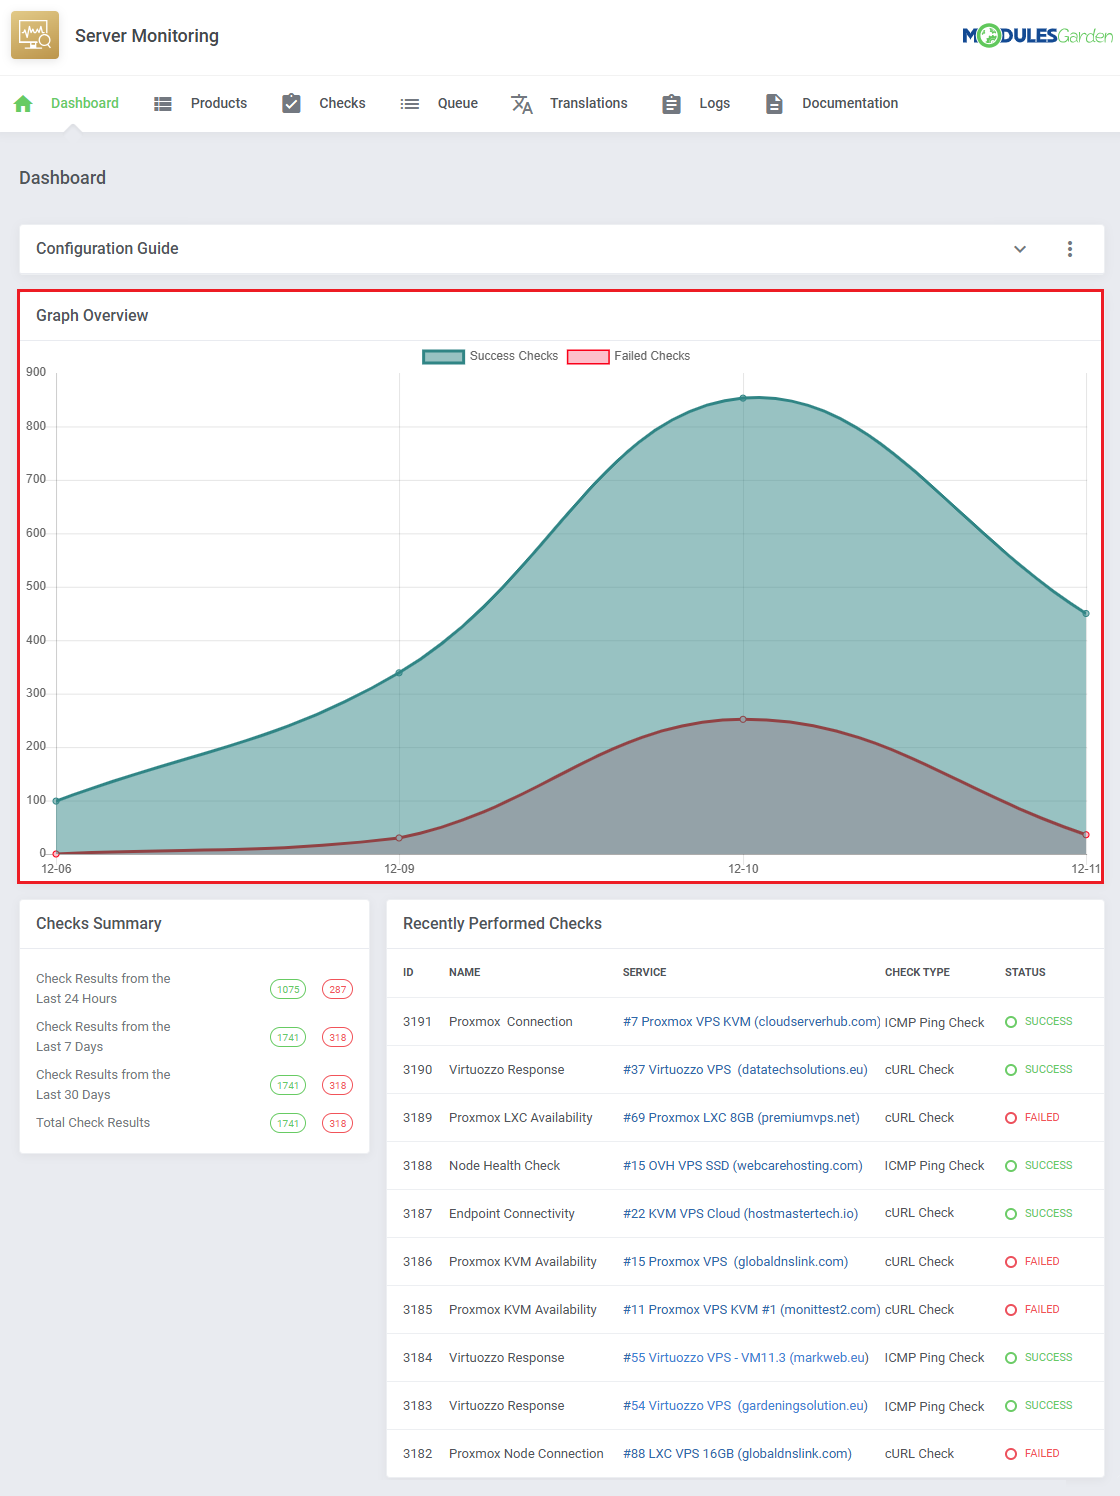
| Graph |
|
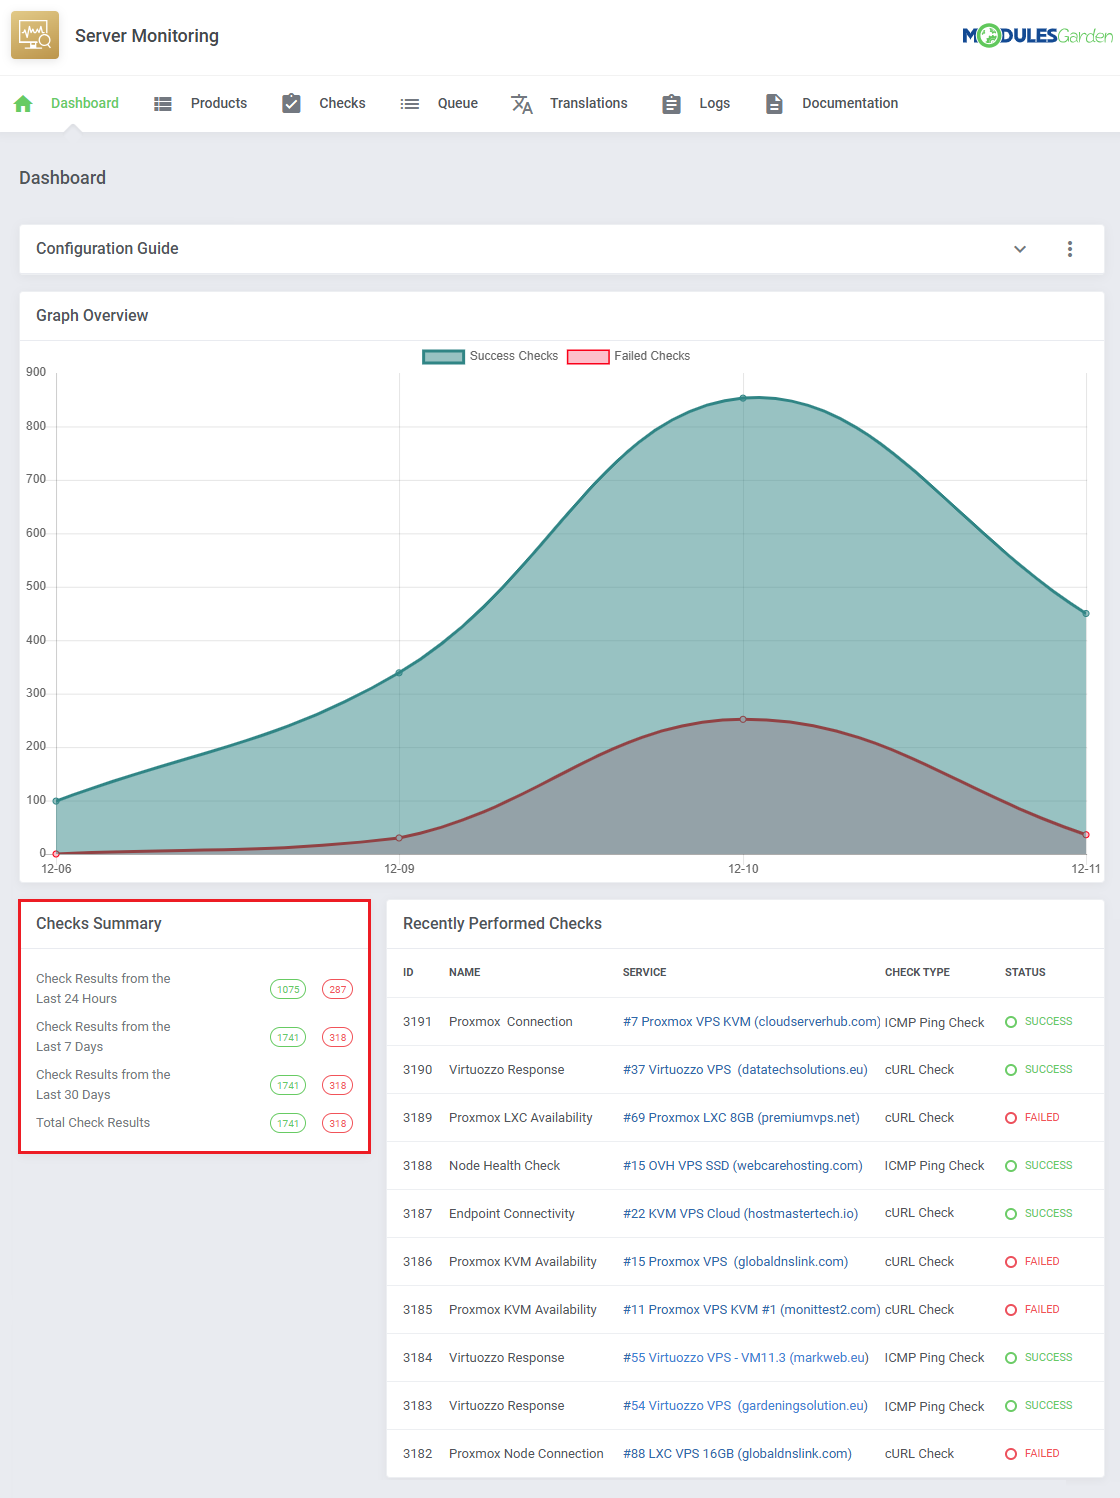
| Summary |
|
| Recent |
|
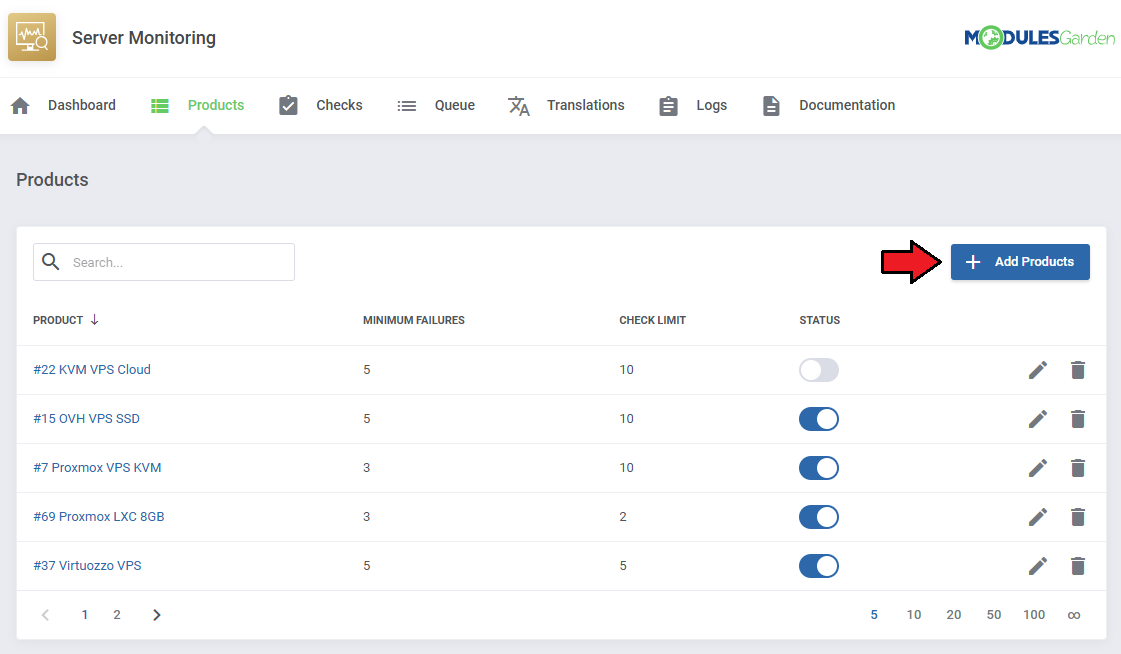
Products
| Add |
|
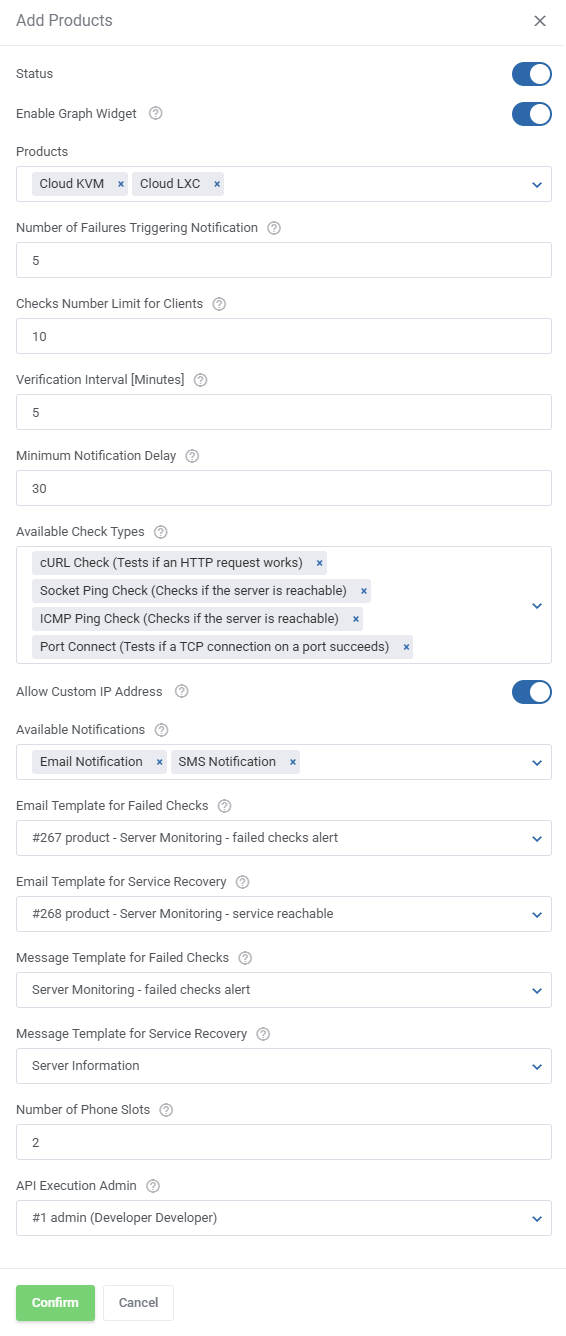
| Add |
|
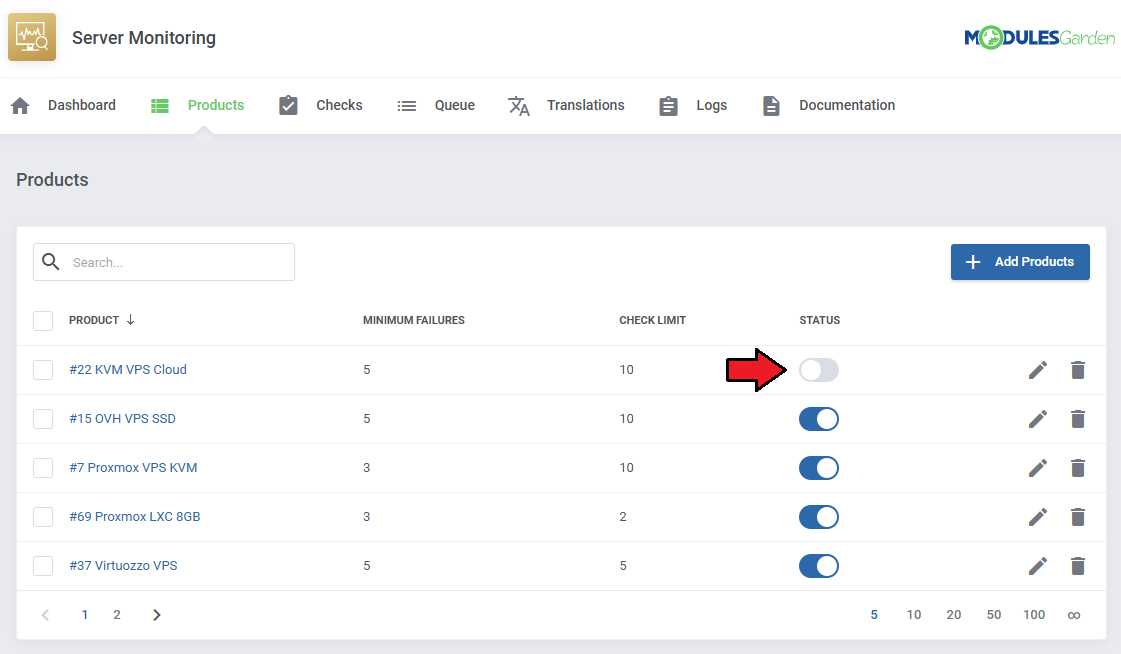
| Toggle |
|
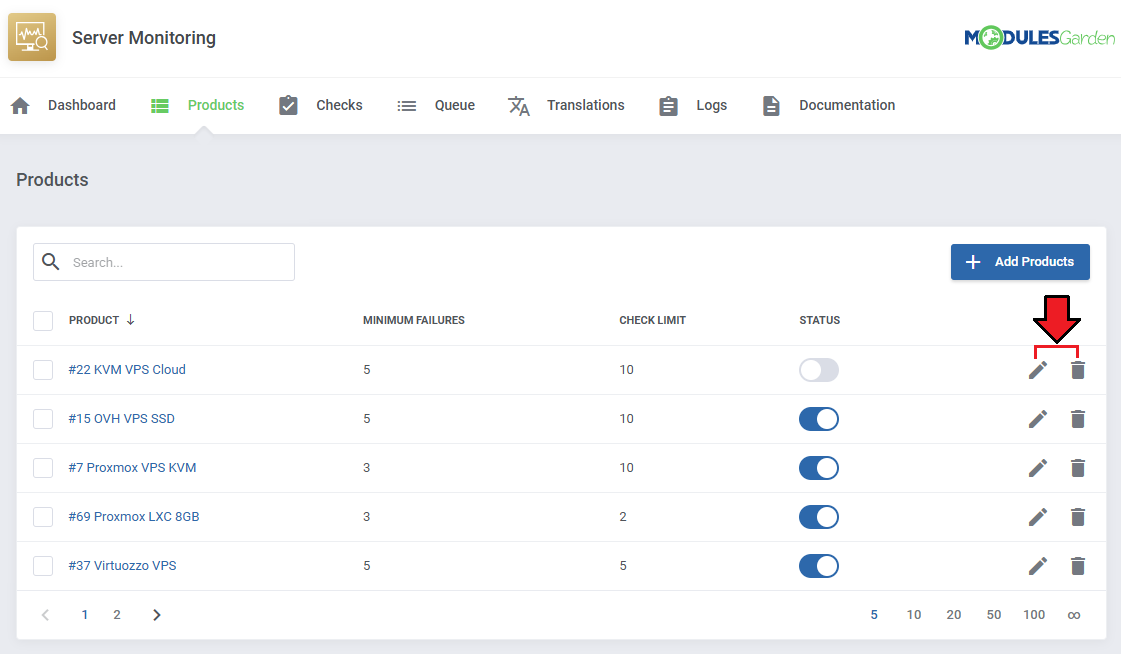
| Actions |
|
Checks
| Once products are added, both admins and clients can create checks for services. To see how clients can add and monitor checks for their services see the Client Area section. |
|
Provide the required fields:
|
|
| Once checks are added, you can turn them off and on with the 'Status' toggle. |
|
| Click the 'Show Logs' button to display logs related to the specific check. |
|
The logs will include:
Note that clients will not be able to see messages when checking logs in the client area. |
|
| Use the action buttons to edit or delete checks as needed. |
|
| The mass action function can be used to delete multiple checks at once. |
|
Queue
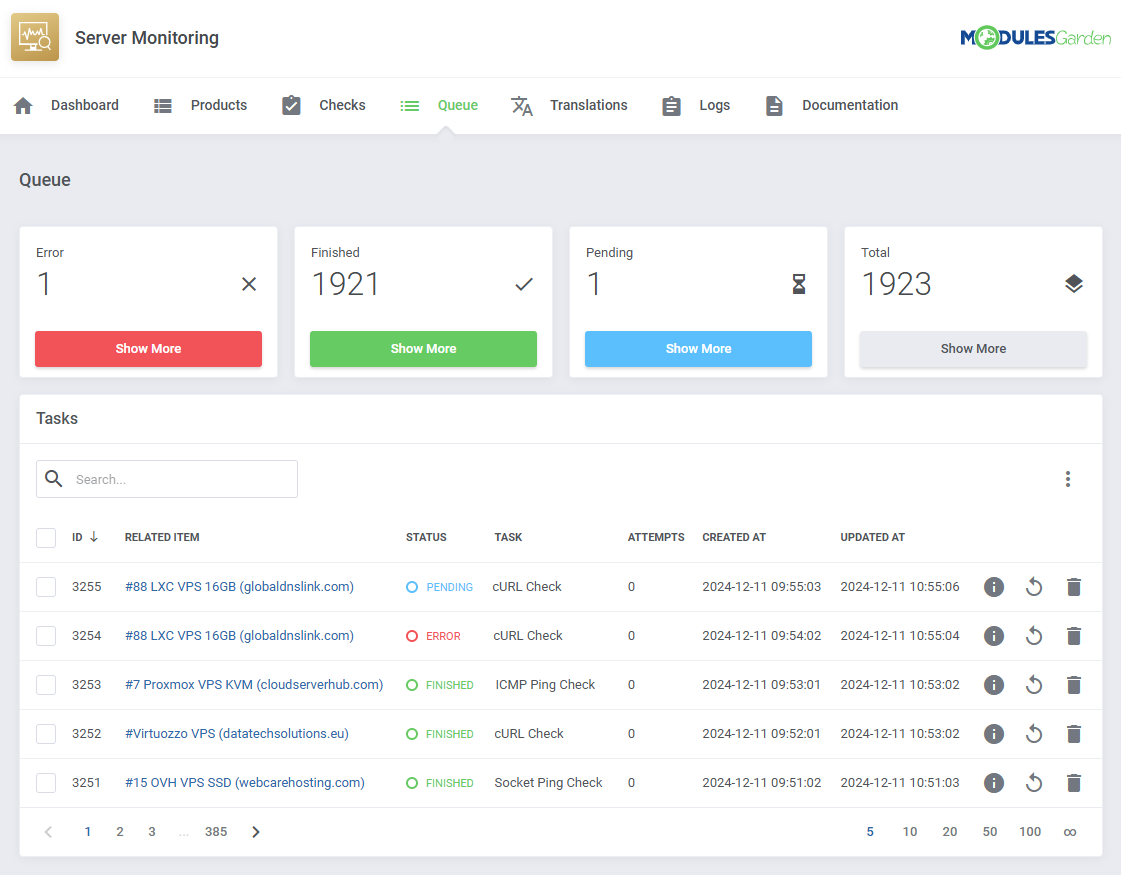
| The "Queue" tool helps you track and manage the tasks created by the module. It allows you to view and interact with task details, including task IDs, statuses, and related items. |
|
Translations
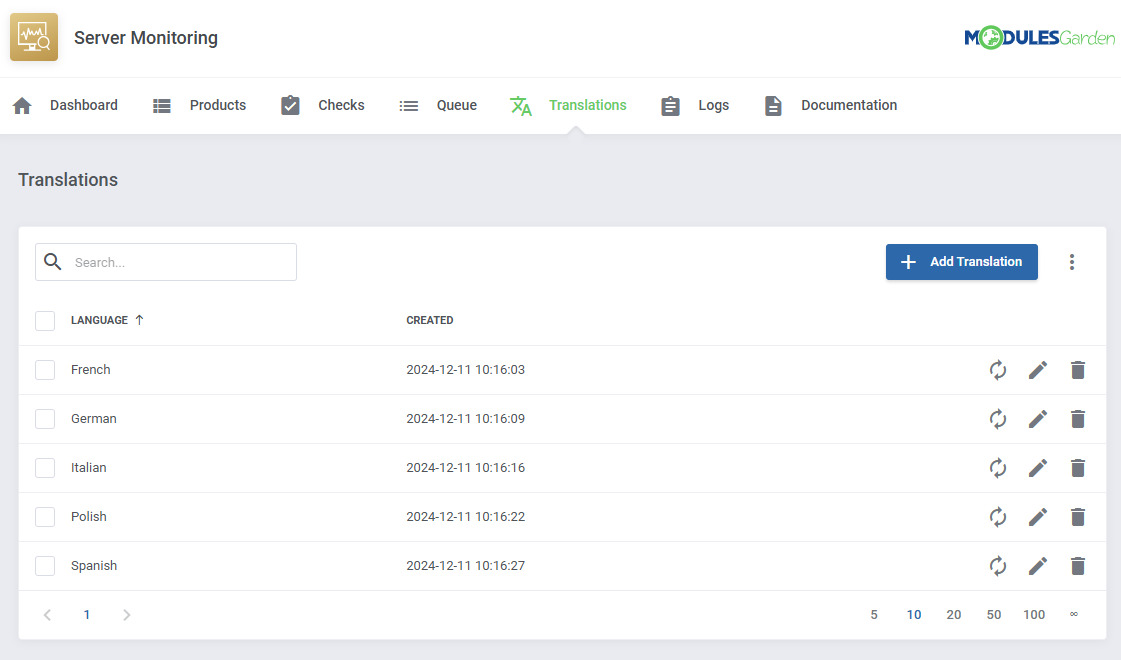
| Customizing language files is now extremely easy with the "Translations" tool that is now available directly in the addon. Its user-friendly design makes managing various language file tweaks a smooth and efficient process. Prepare translations for the original English files with this handy built-in tool. For specific instructions on how to use this tool please refer to its dedicated article, you will find it here. |
|
Logs
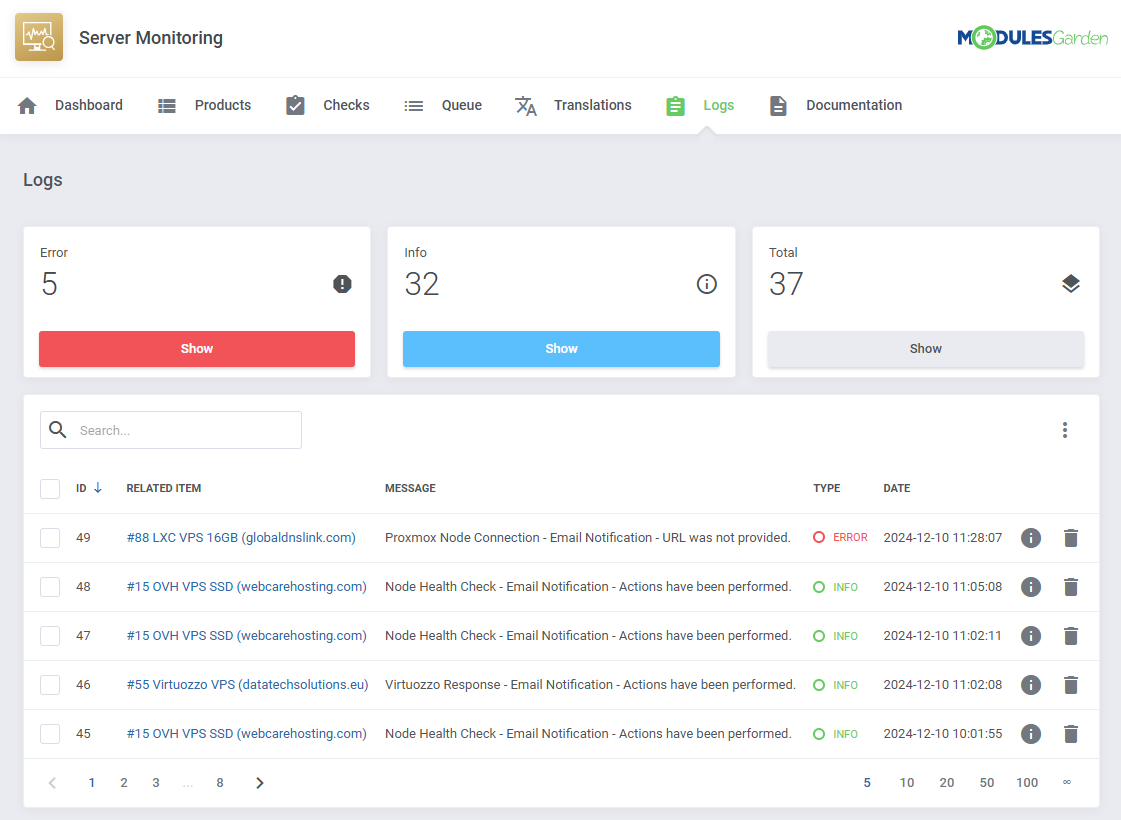
| The "Logs" tool makes monitoring and managing module activity records simple and efficient. It provides options to categorize, filter, and view detailed entries, giving you control over the logs. Features like bulk deletion, rule-based deletion, and export options make it easy to organize and maintain your logs. For detailed guidance on using this tool, check its dedicated article, which is available here. |
|
Client Area
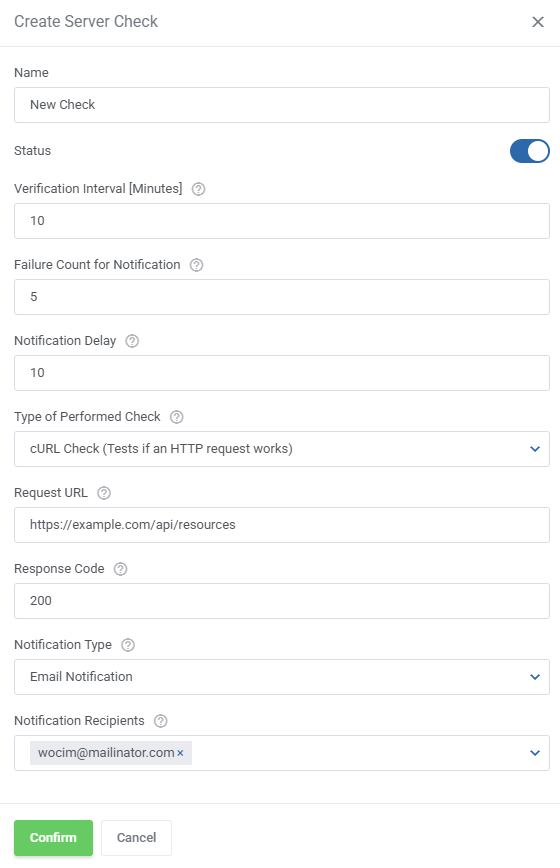
| Clients will be able to take advantage of Server Monitoring For WHMCS too, as long as they own one of the products you have configured. The basic client area integration allows them to create and monitor checks for their service, within restrictions opposed by the admin. |

|
Fill the necessary fields:
|
|
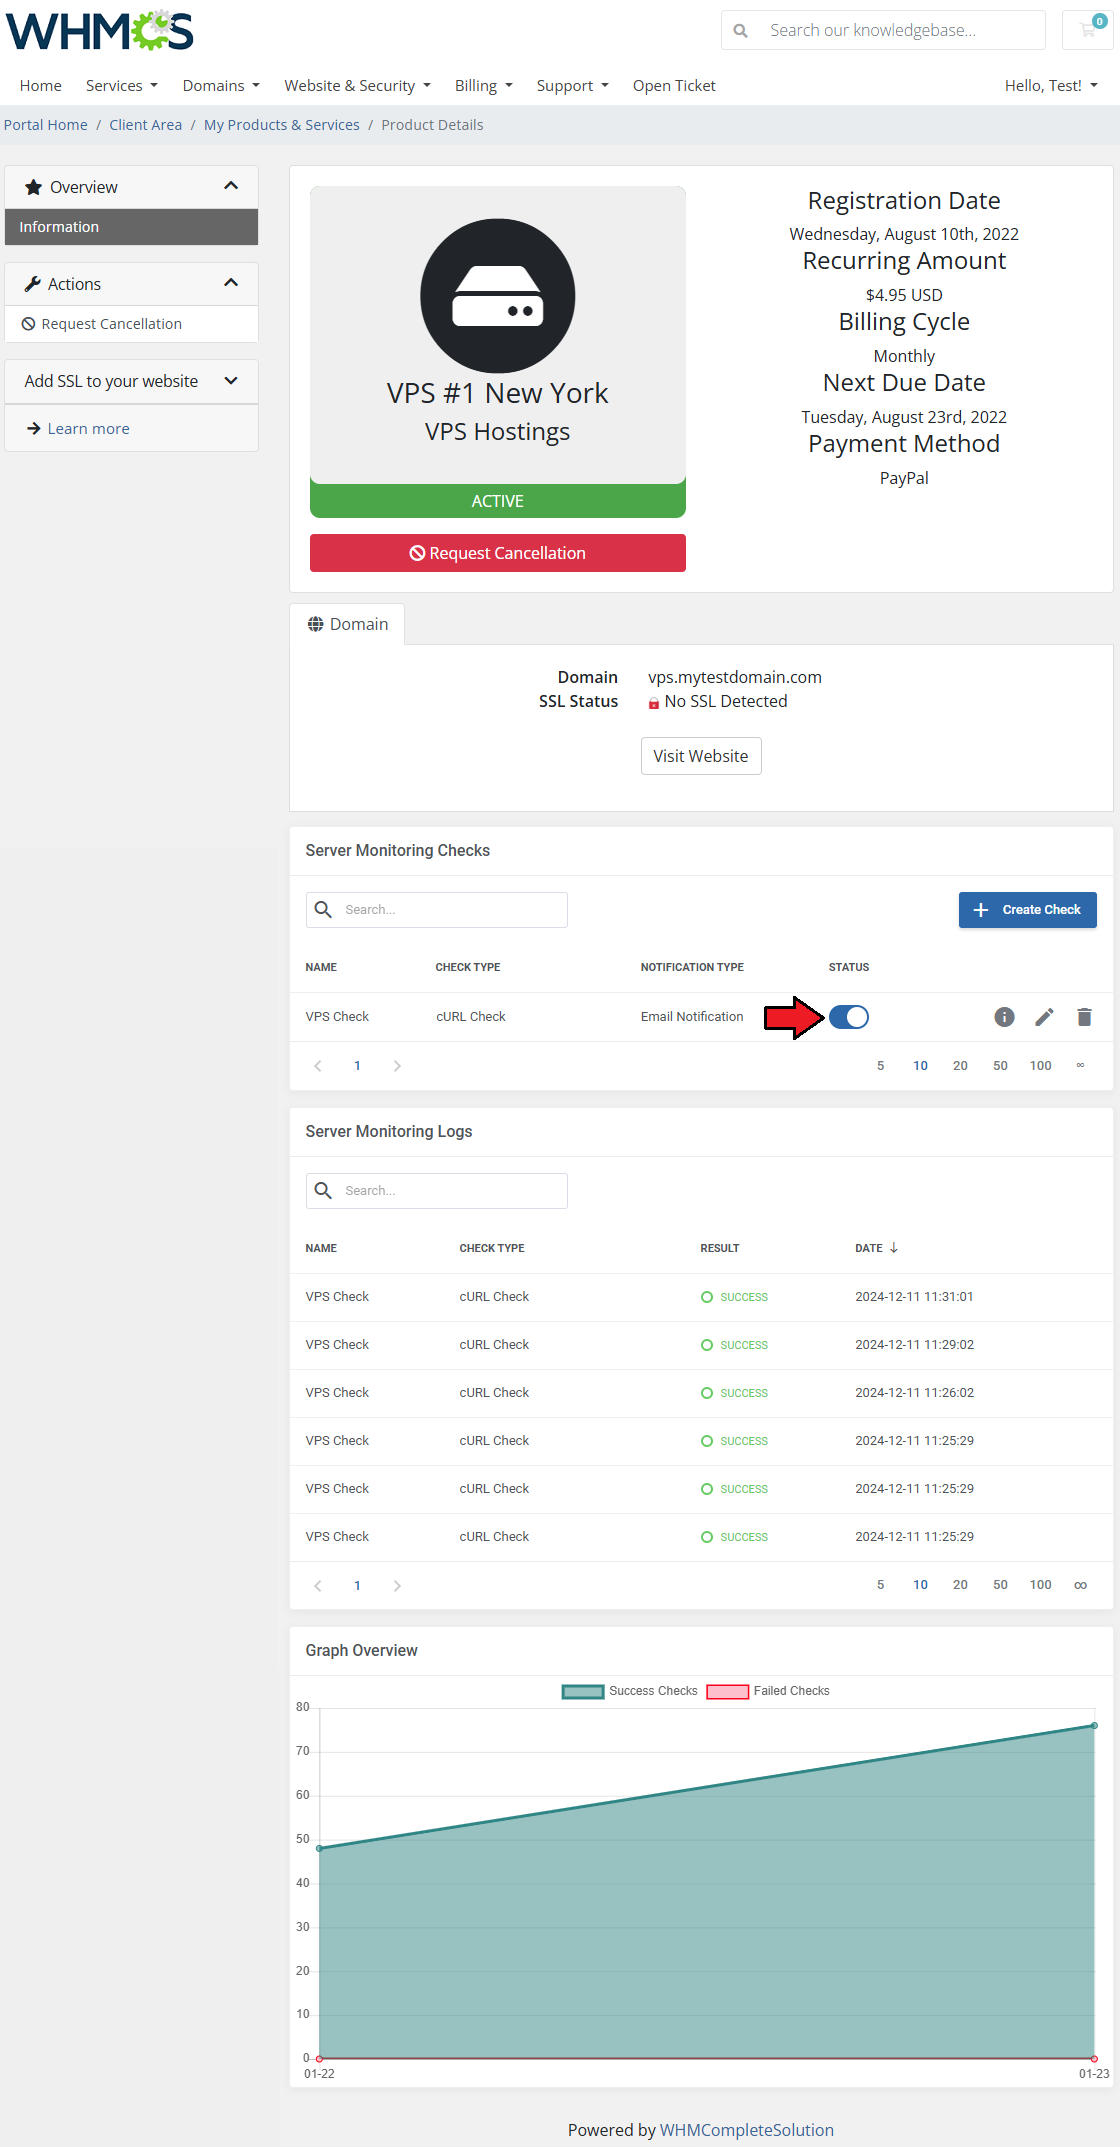
| Once the check is added, you can toggle it on/off as needed with the 'Status' toggle. |
|
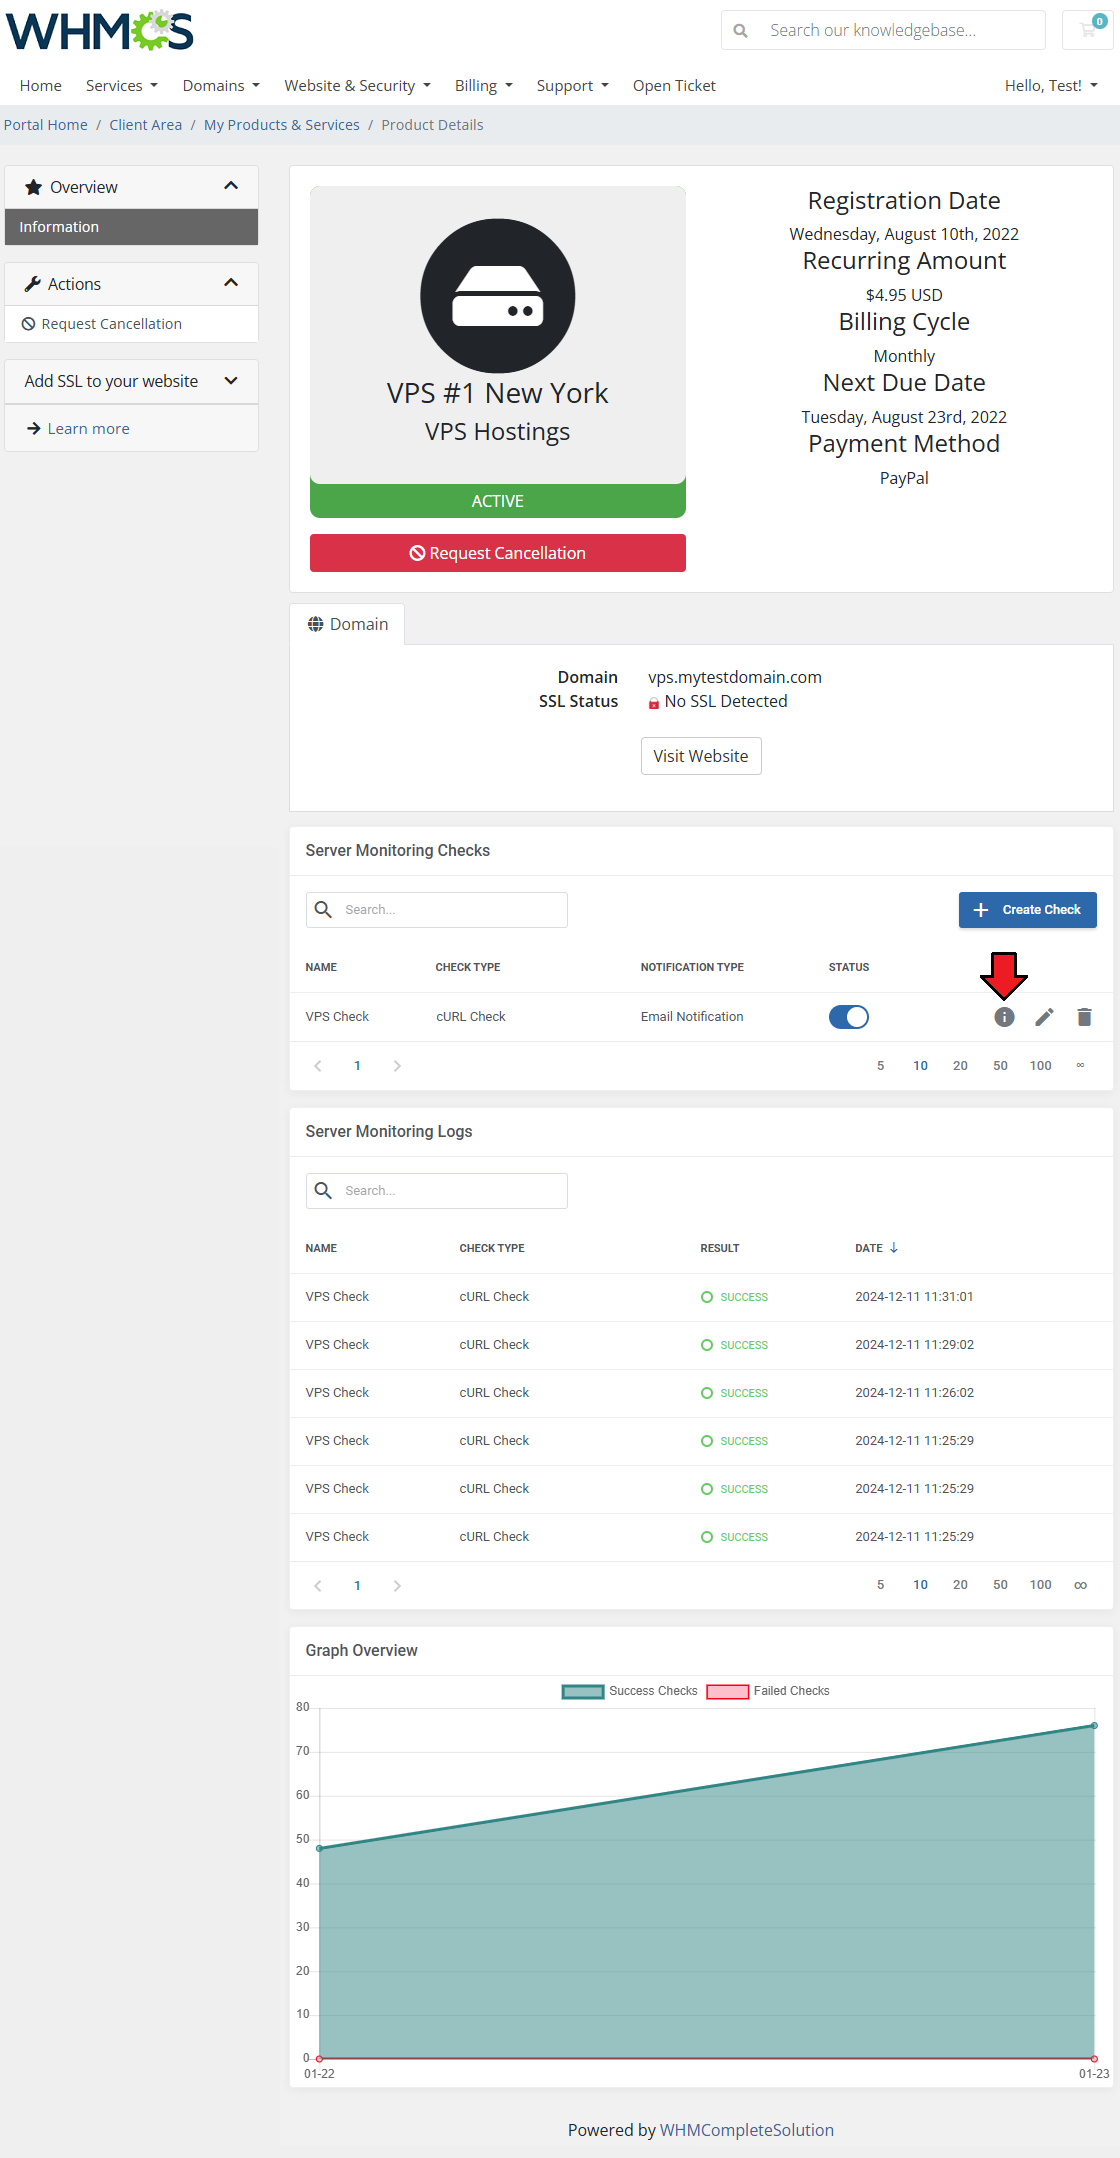
| You can display logs for the specific check by clicking on the 'Show Logs' button. |
|
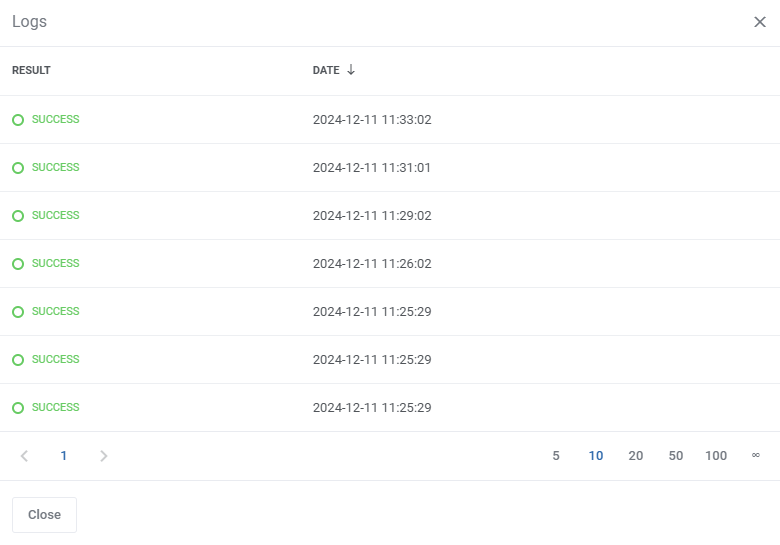
| The logs only include results of the selected check, as opposed to all logs in the table below. |
|
| Use the action buttons to edit or delete created checks whenever you need to. Consider disabling a check with the 'Status' toggle before deleting it for good. |

|
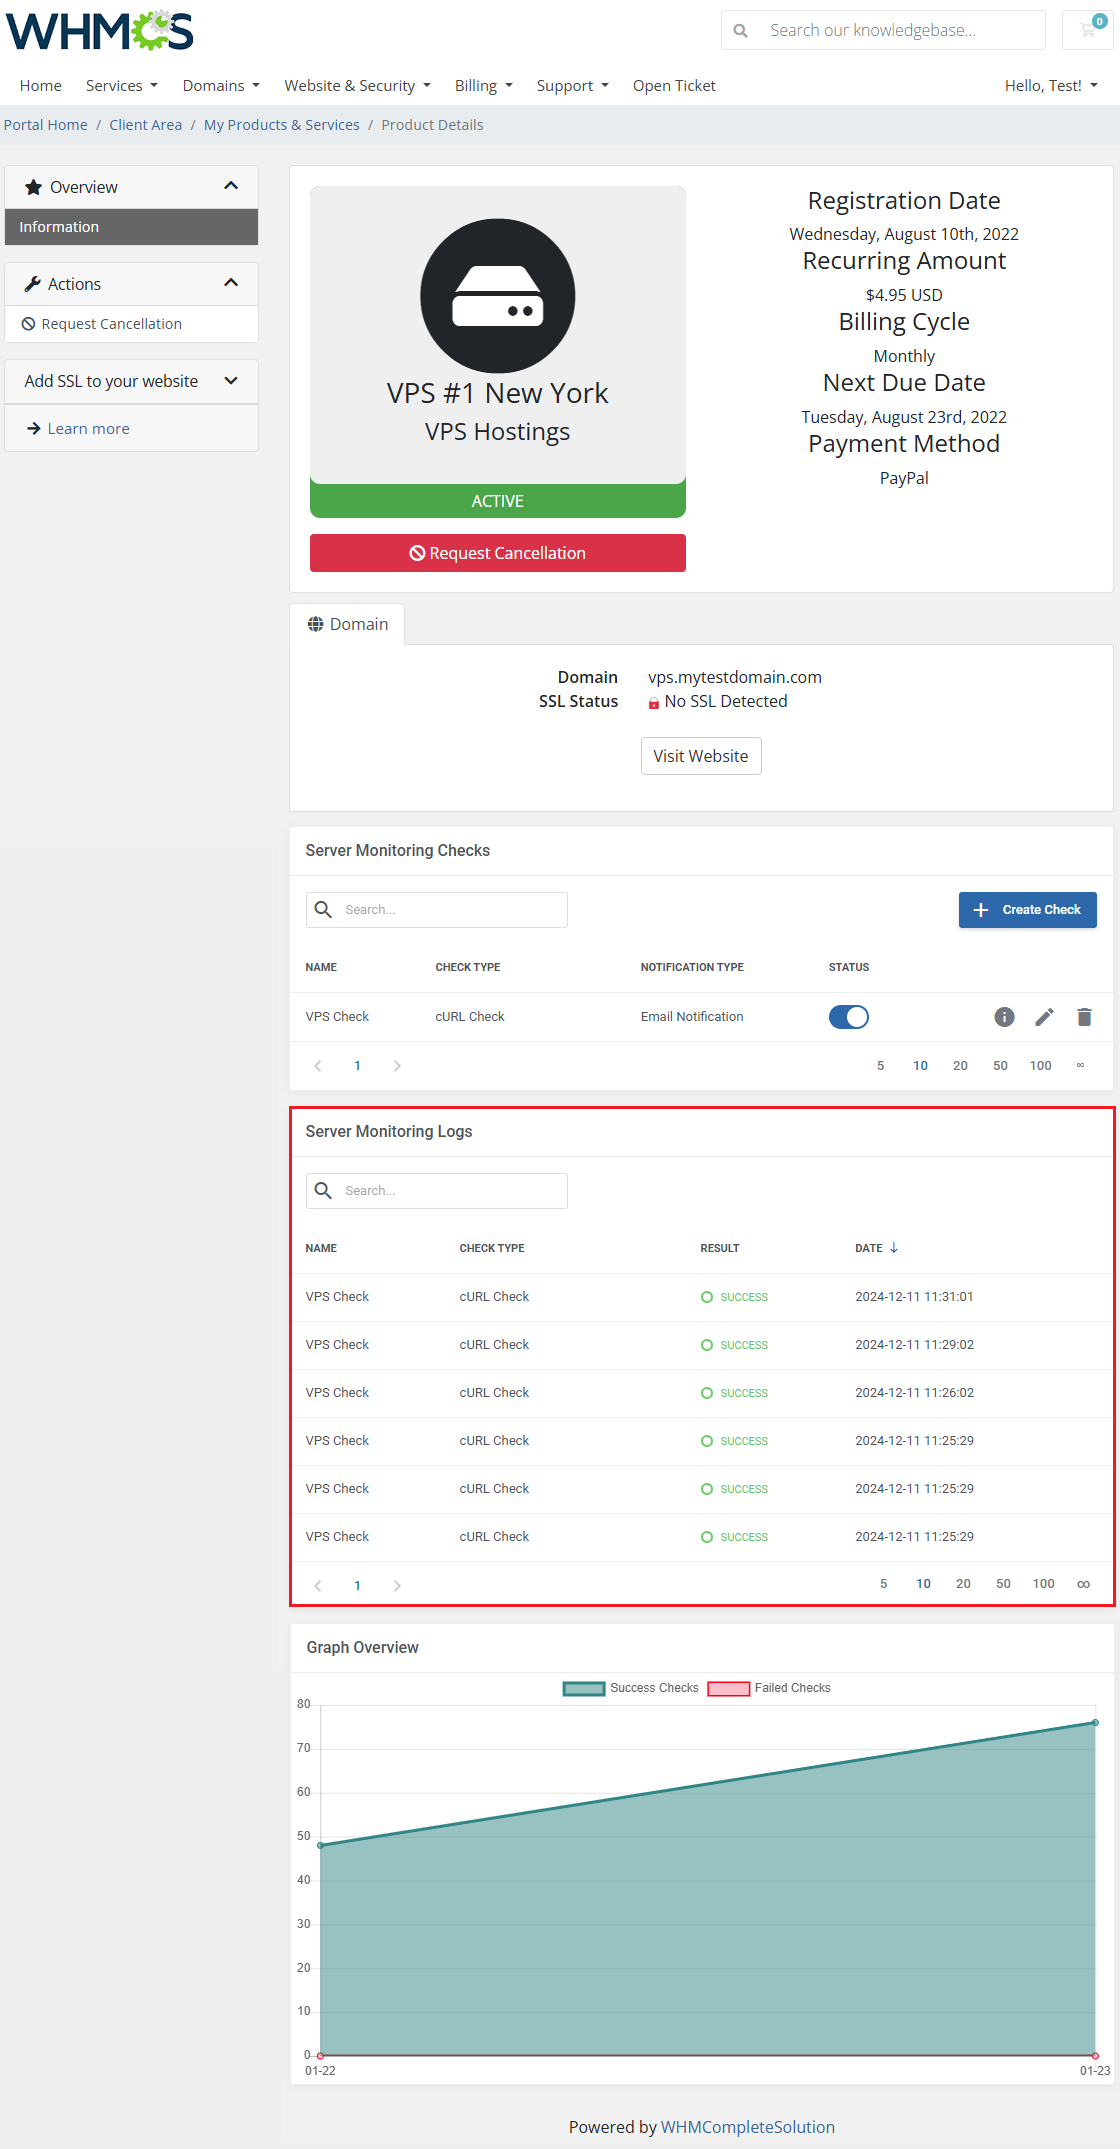
| The 'Server Monitoring Logs' list check history of every check related to the service in a single table. |
|
Proxmox Integration
Not in 1.0
Update Instructions
| An essential guidance through the process of updating the module is offered here. Ensure successful completion of the module update by carefully following each step, thereby preventing data loss or any unforeseen issues. |
Upgrade Guide
| Seeking a solution that offers greater flexibility, customization tailored to your precise needs, and unrestricted availability? There is an option that not only proves to be cost-effective in the long run but also includes prioritized support services, making it a truly valuable investment. Opt for the Open Source version of your Server Monitoring For WHMCS module to unlock these benefits. Follow a comprehensive guide covering the transition process, the advantages it brings, and step-by-step instructions on what to do next after the order has been successfully finalized. |
Common Problems
| 1. When you have problems with connection, check whether your SELinux or firewall does not block ports. |