Hosting Quota Notifications 1.X For WHMCS
From ModulesGarden Wiki
(Difference between revisions)
|
|
| Line 228: |
Line 228: |
| | ====Files==== | | ====Files==== |
| | {| | | {| |
| − | |style="padding: 10px 0px 20px 15px;"|The first section is dedicated to any types of files that exist in your system, with some brief info and divided into categories: | + | |style="padding: 10px 0px 20px 15px;"|The first dedicated section concerns any types of files that exist in your system, with some brief info and divided into categories: |
| | *WHMCS Addons Files | | *WHMCS Addons Files |
| | *WHMCS Templates Files | | *WHMCS Templates Files |
| Line 250: |
Line 250: |
| | |style="padding: 0px 0px 30px 25px;"|[[File:WHA_8_2.png]] | | |style="padding: 0px 0px 30px 25px;"|[[File:WHA_8_2.png]] |
| | |} | | |} |
| | + | |
| | ====Modules==== | | ====Modules==== |
| | {| | | {| |
Revision as of 15:47, 1 June 2016
Article update is ongoing on this page, watch out for broken links and unclear descriptions!
We are sorry for the inconvenience caused.
WHMCS Analyzer is an innovative product that allows constant monitoring of your WHMCS system. Gather crucial data on your system,
server and many others. Make regular scans to get a list of current issues that may raise and read suggested solutions to avoid or clarify them.
|
| ✔ View WHMCS Modification Rating
|
| ✔ View Results Of WHMCS Recommendations & Requirements Tests
|
| ✔ View Server Environment Information
|
| ✔ View WHMCS Environment Information
|
| ✔ View WHMCS Files Information
|
| ✔ View WHMCS Database Information
|
| ✔ View List Of Possible Issues And Solutions
|
| ✔ Download WHMCS Environment Scan As PDF
|
| ✔ View Results Of ModulesGarden Modules' Version Check
|
| ✔ View Graphic Summary Of Performed Tests
|
| ✔ View Detailed Description Of Each Test Results
|
| ✔ View Brief Files Summary
|
| ✔ View Installed Addon Modules
|
| ✔ View Installed Template Files
|
| ✔ View Installed Order Form Template Files
|
| ✔ View Custom Files - Not Existing In Clean WHMCS Installation
|
| ✔ View List Of Suspicious Files
|
| ✔ View Active Addon Modules
|
| ✔ View Active Registrar Modules
|
| ✔ View Active Payment Gateway Modules
|
| ✔ View Active Provisioning Modules
|
| ✔ View Complex Information About Installed Hook Files
|
| ✔ View Basic WHMCS Database Information
|
| ✔ View Database Tables List
|
| ✔ View Logged Database Errors
|
| ✔ View List Of Suspicious Email Templates
|
| ✔ View Server Information
|
| ✔ View List Of Installed PHP Modules
|
| ✔ View Basic WHMCS Settings
|
| ✔ Supports WHMCS V5.3.14 and Later
|
Installation and Configuration
This tutorial will show you how to successfully install and configure WHMCS Analyzer.
We will guide you step by step through the whole installation and configuration process.
|
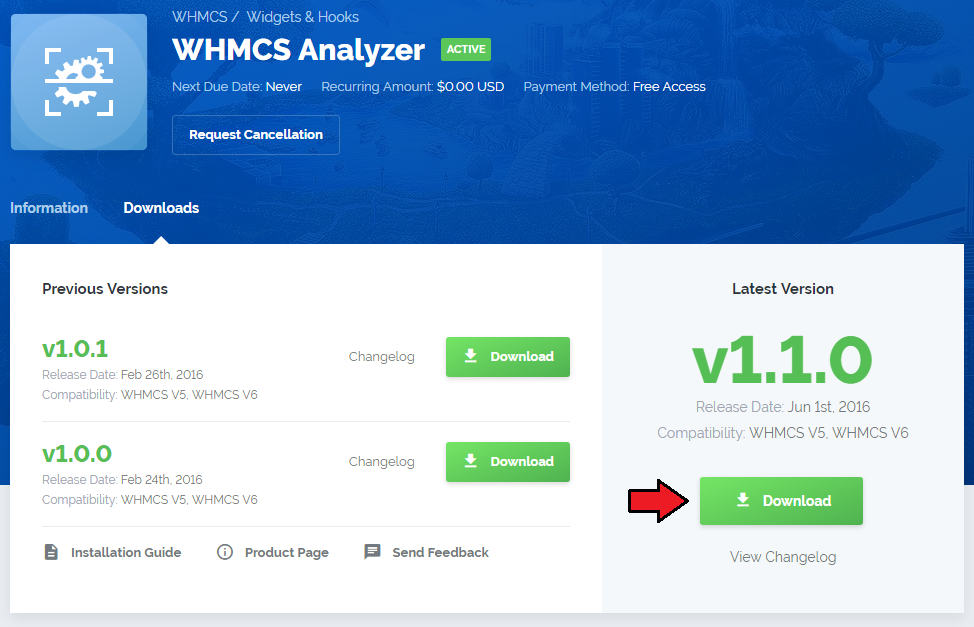
| 1. Download WHMCS Analyzer directly from our webpage.
|
2. Upload and extract the files into the main WHMCS directory.
Files in your WHMCS directory should look like on the following screen.
|
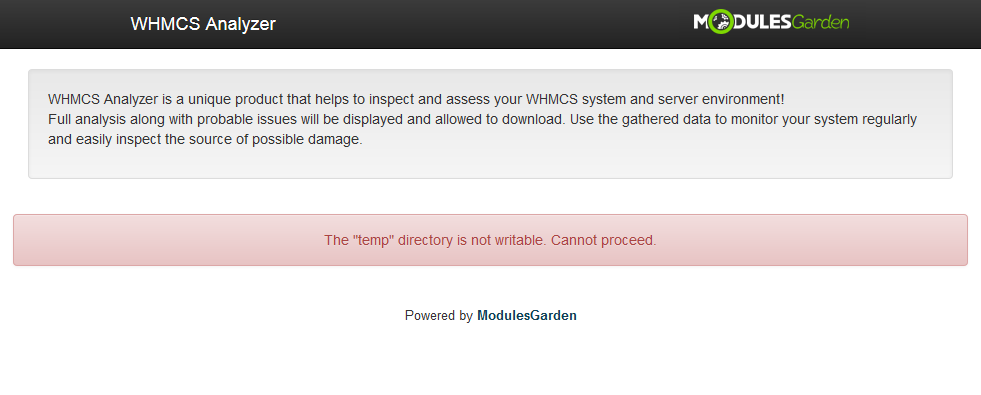
3. Now you have to allow access to 'analyzer' and 'temp' files, change access rights as writable.
Proceed to 'YourWHMCS → Analyzer'. Set access rights to the mentioned file as writable.
That is all, you may move the script itself!
|
Management
| WHMCS Analyzer is a disparate product that works outside of your WHMCS system to provide you a comprehensive view on its every single aspect.
|
Start Analysis
In order to start your system analysis, please enter 'analyzer' directory in your browser, like in the example:
http://your_WHMCS/analyzer
|
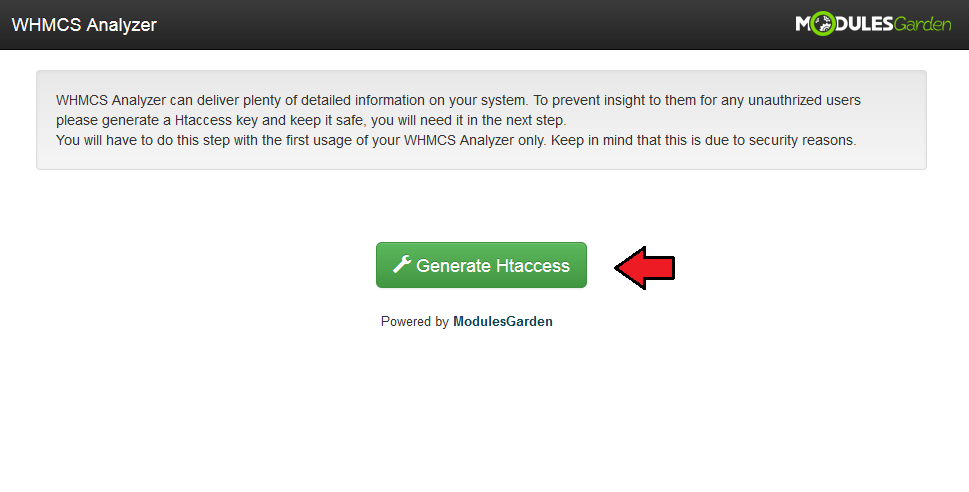
In the every beginning you will be asked to generate htaccess. This step is obligatory due to security reasons.
You will be asked to do that only when using the script for the first time.
|
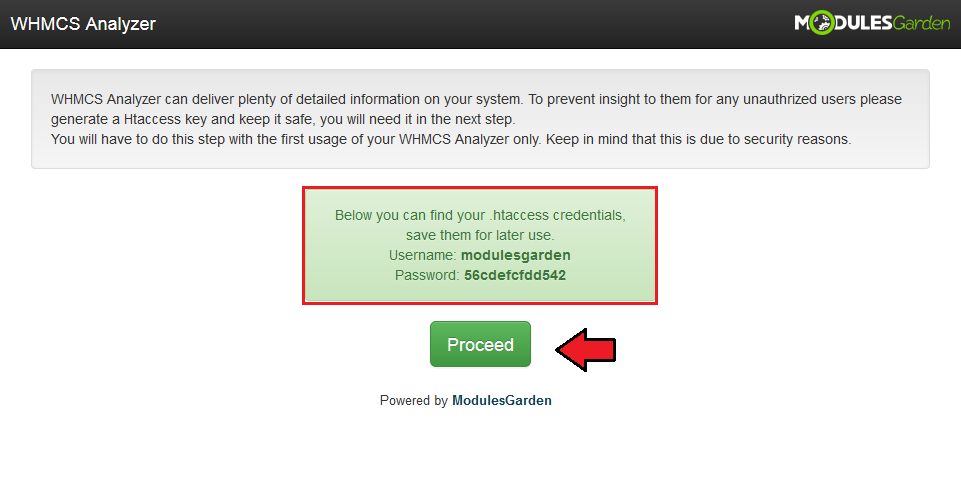
| Please note the generated username and the password, you will need them in the every next step to get access to the product.
|
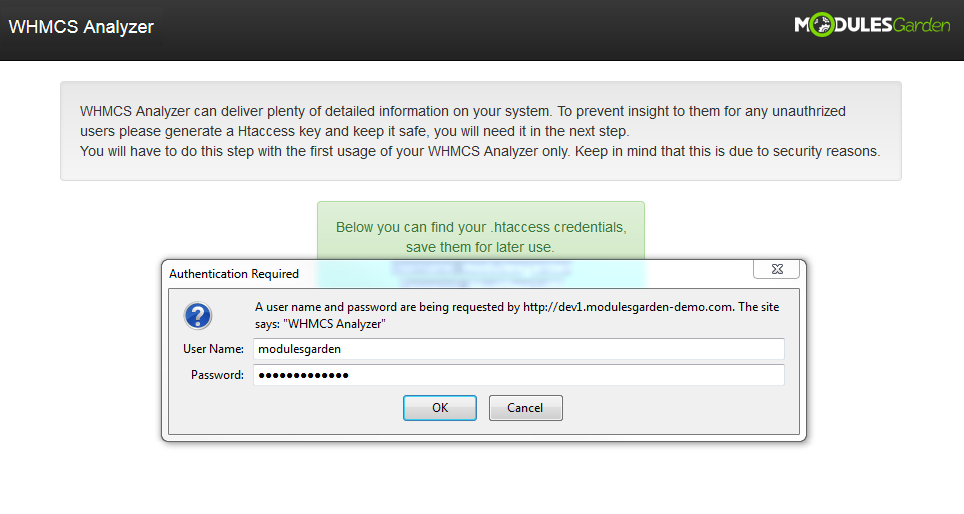
| Now, type in the generated in the previous step username and password to continue.
|
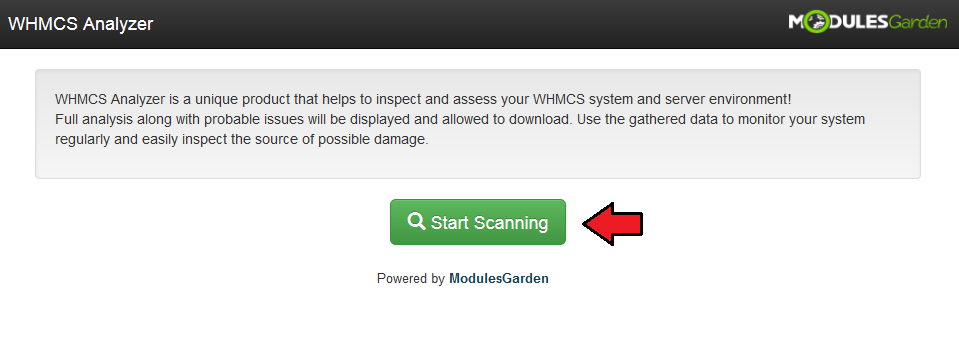
| That's it! You may finally scan your system. Press 'Start Scanning' button when such appears.
|
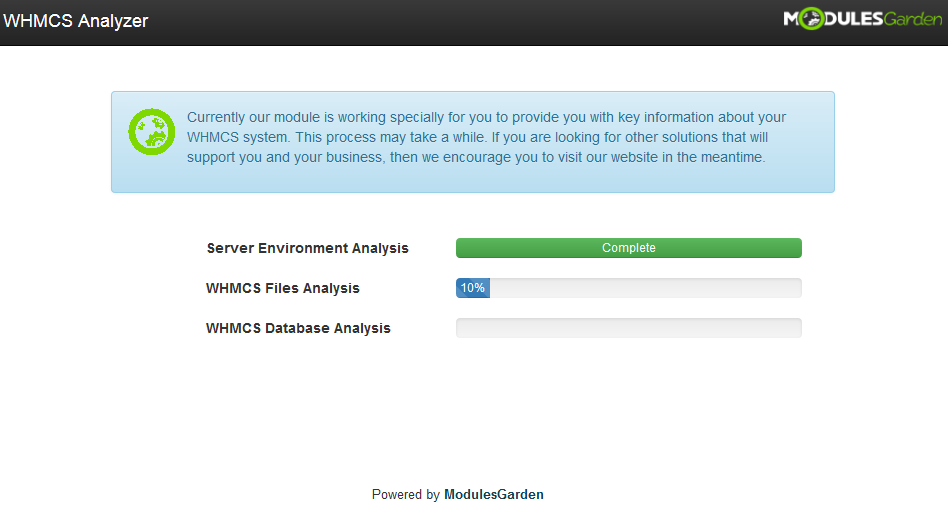
| Wait a moment until every part is completed successfully.
|
Analysis Summary
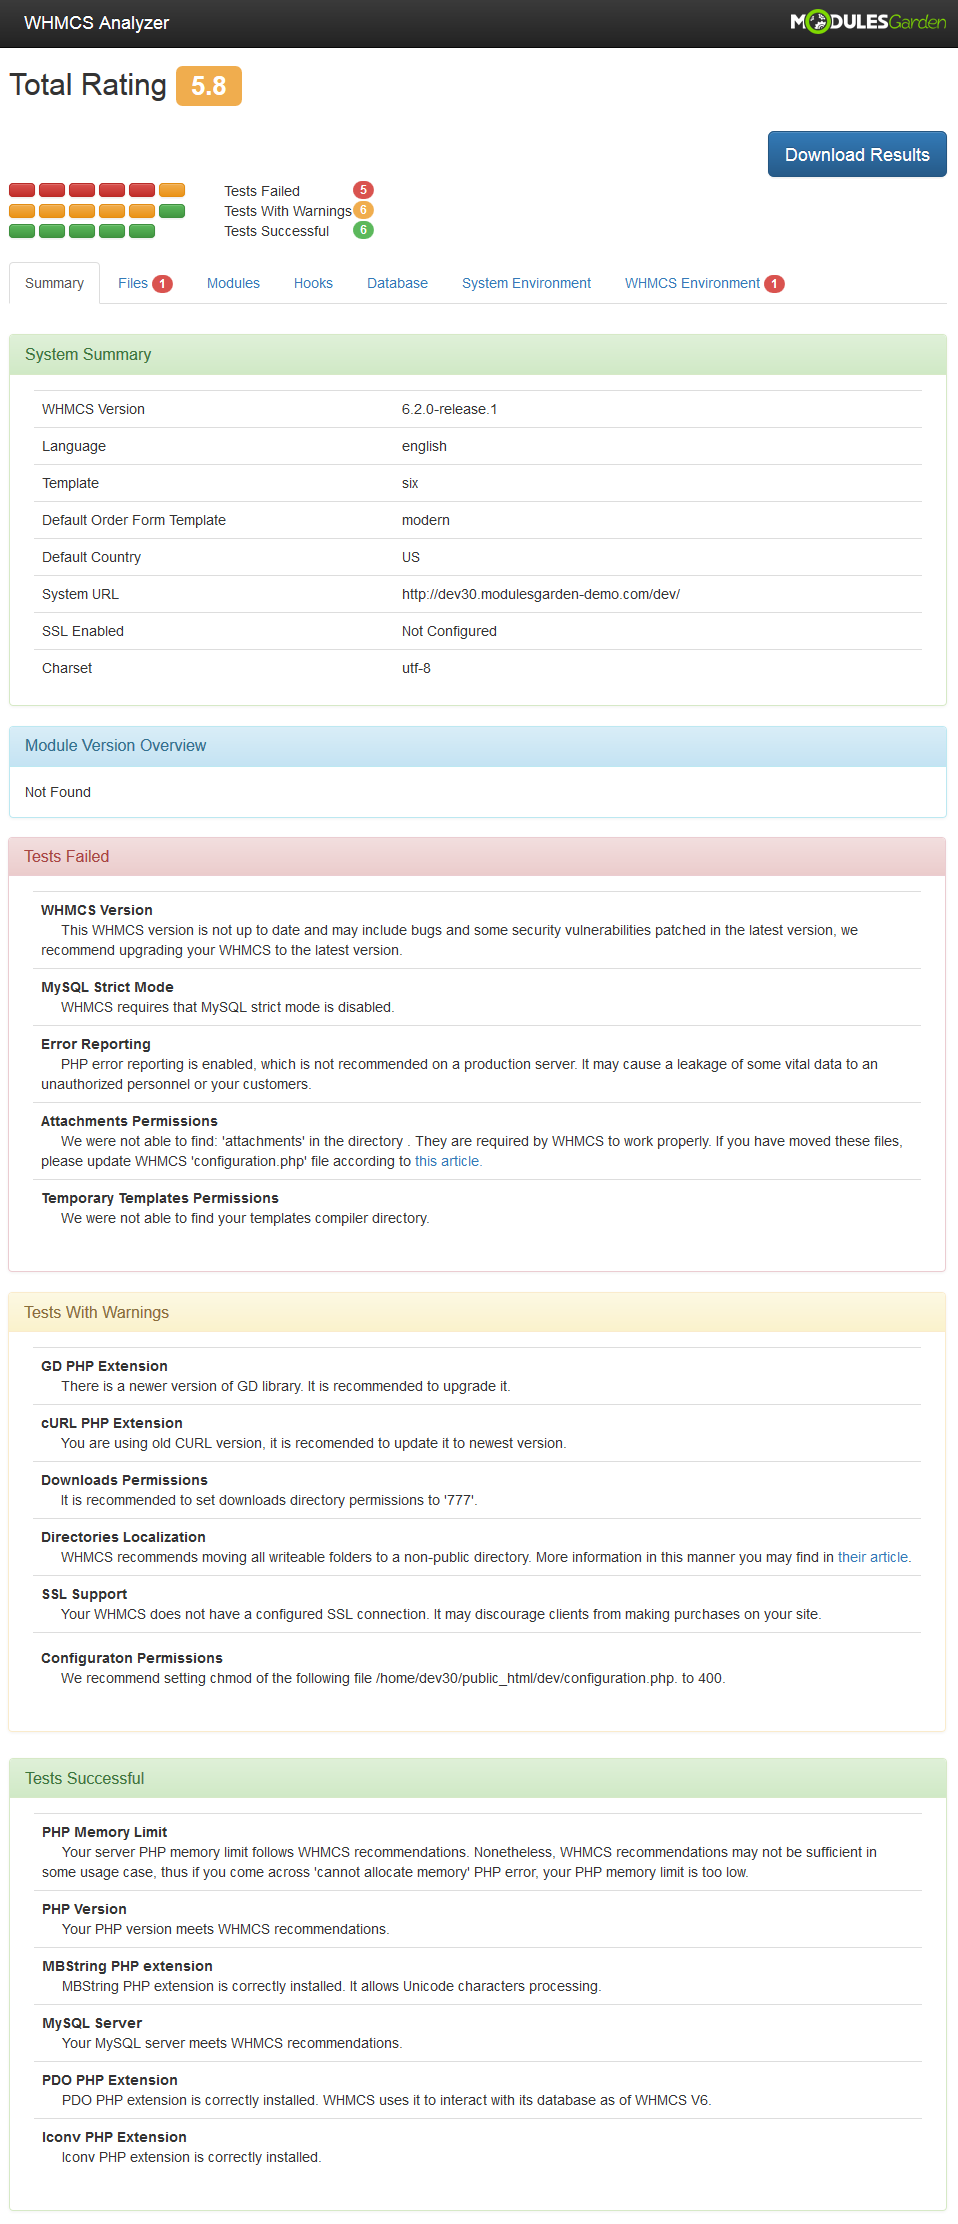
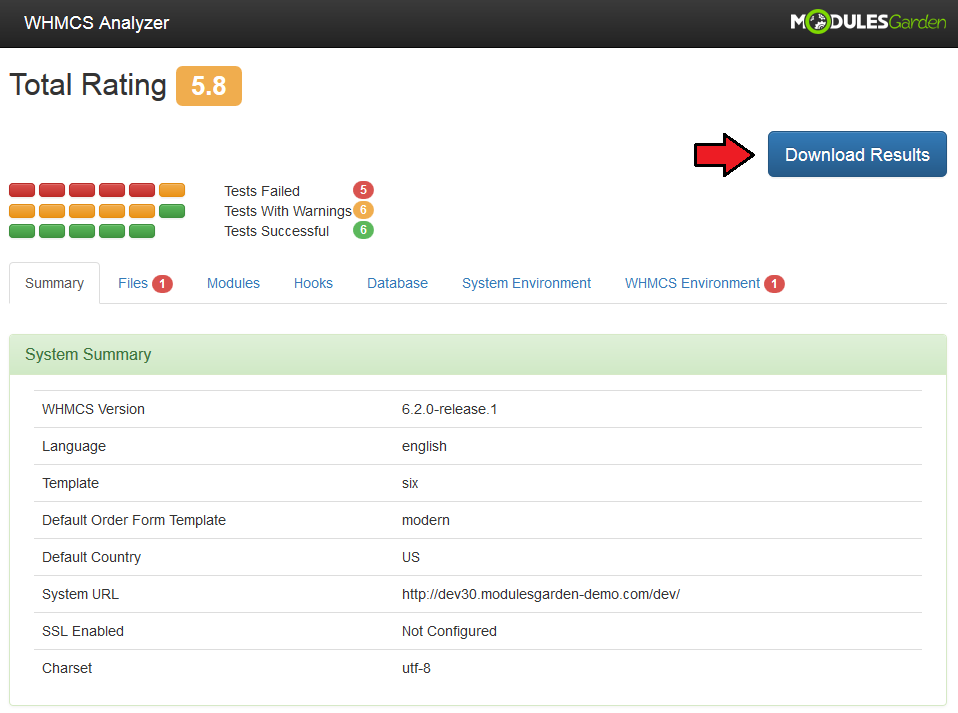
When the analysis process has finished successfully, a full summary will be displayed on your screen.
Read the below section to get a full view on data you will find there.
|
Total Rating
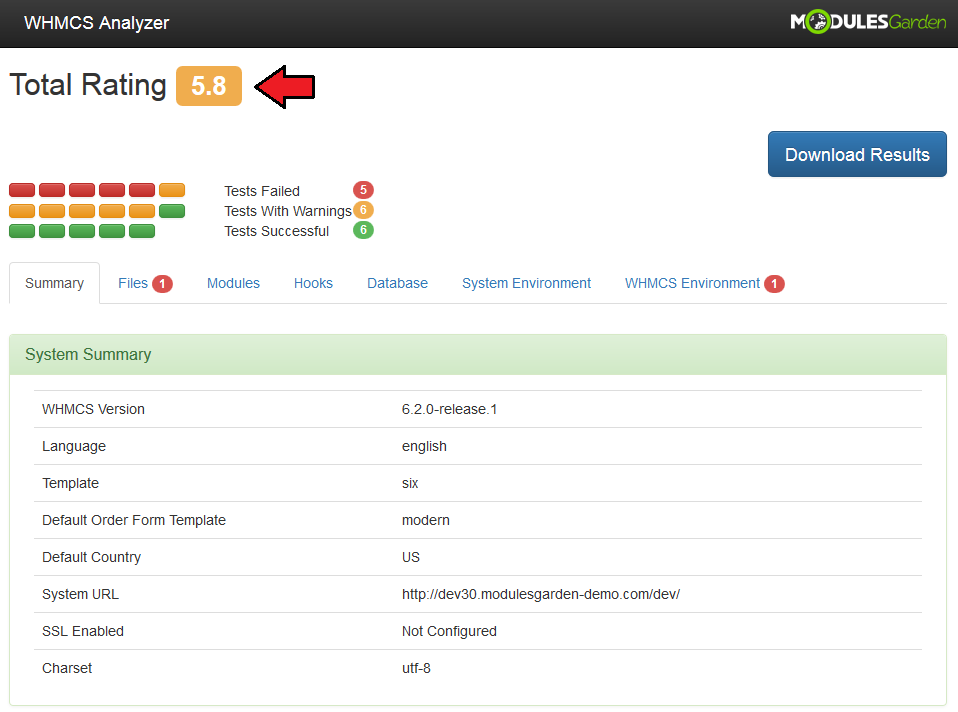
As a very first piece of information you will find 'Total Rating'. This is an objective evaluation of your system as a whole.
The highest possible rate of any system is 6.0. If you have a lower grade, then your system probably lacks in some of the below features.
Aspects taken into consideration when carrying out the evaluation:
- WHMCS version
- PHP version
- detected possible issues
|
Analysis In Details
Summary
WHMCS Analyzer prepares a detailed summary on your system condition. The results are divided into four general categories, these are:
- System Summary
- Module Version Overview
- Three types of tests:
- Tests Failed
- Tests with Warnings
- Tests Successful
|
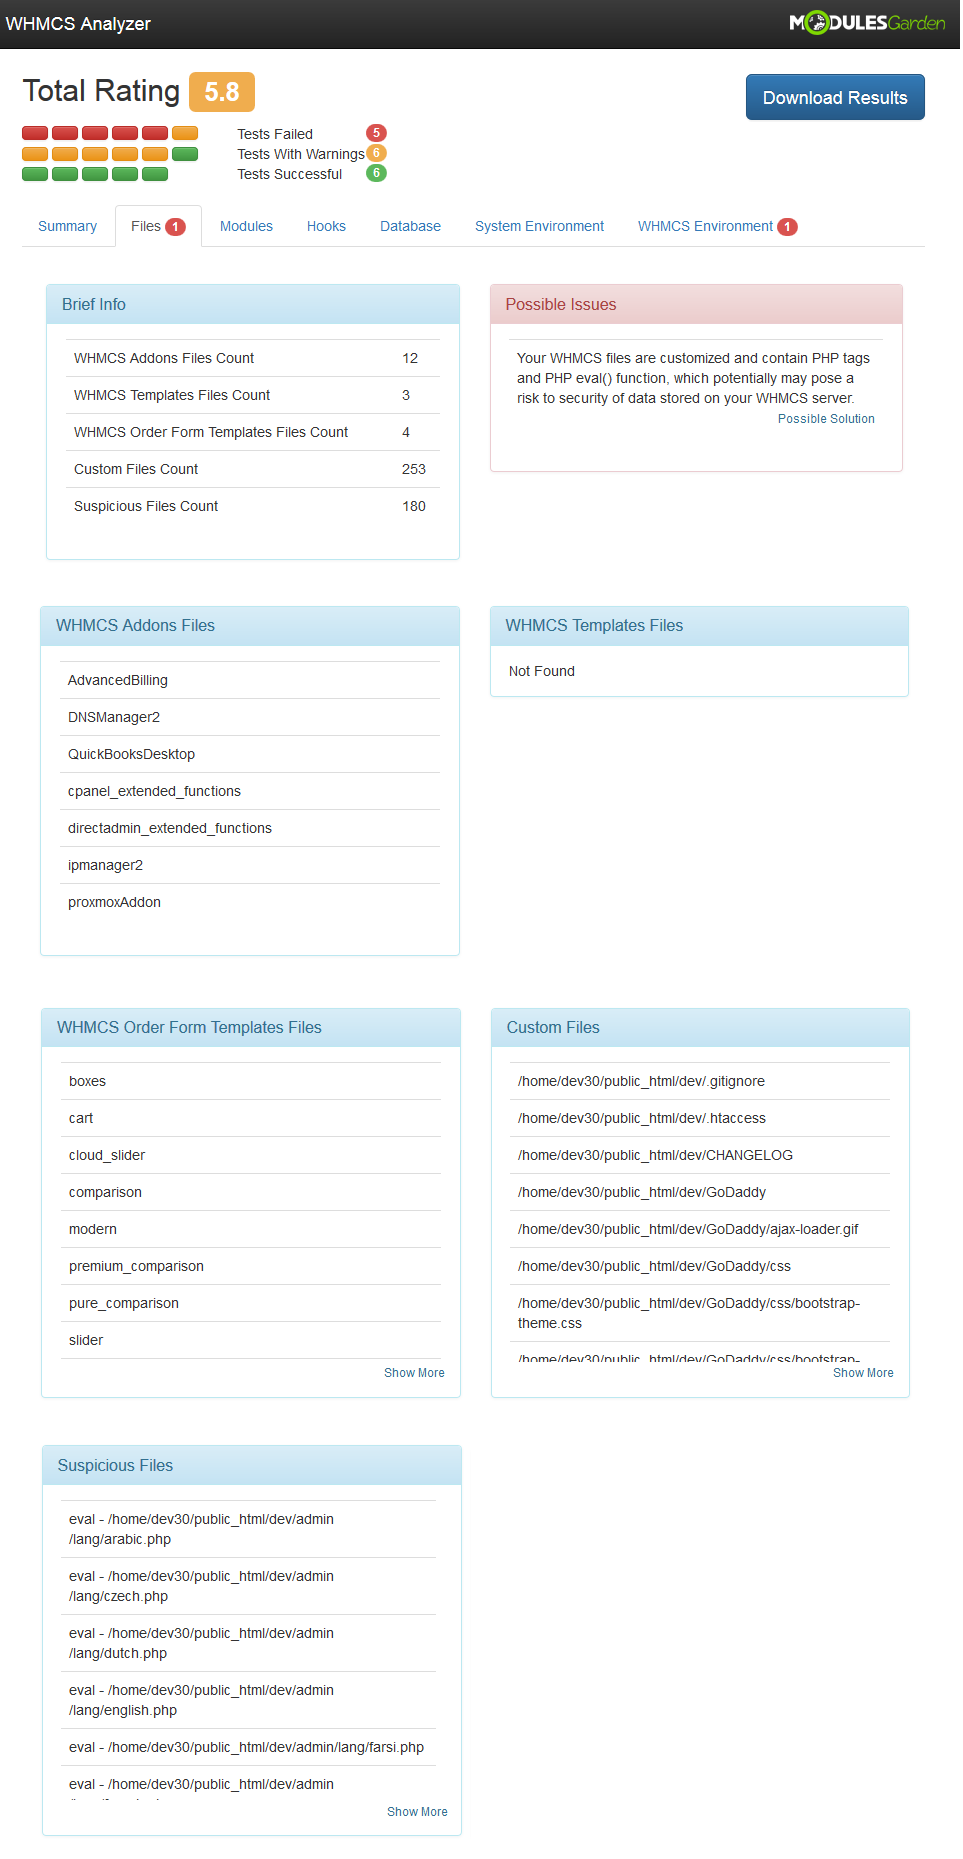
Files
The first dedicated section concerns any types of files that exist in your system, with some brief info and divided into categories:
- WHMCS Addons Files
- WHMCS Templates Files
- WHMCS Order Forms Templates Files
- Custom Files
- Suspicious Files
|
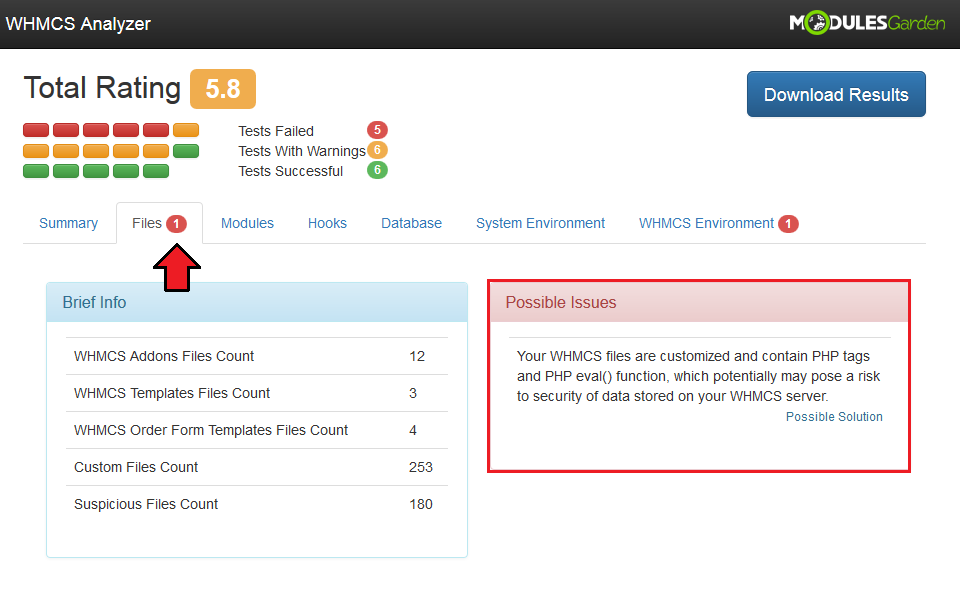
You will also find there a list of 'Possible Issues'. In this box there are always enumerated and described points which may cause some interruptions
in your WHMCS usage. It is important to always analyze them carefully and clarify if possible.
|
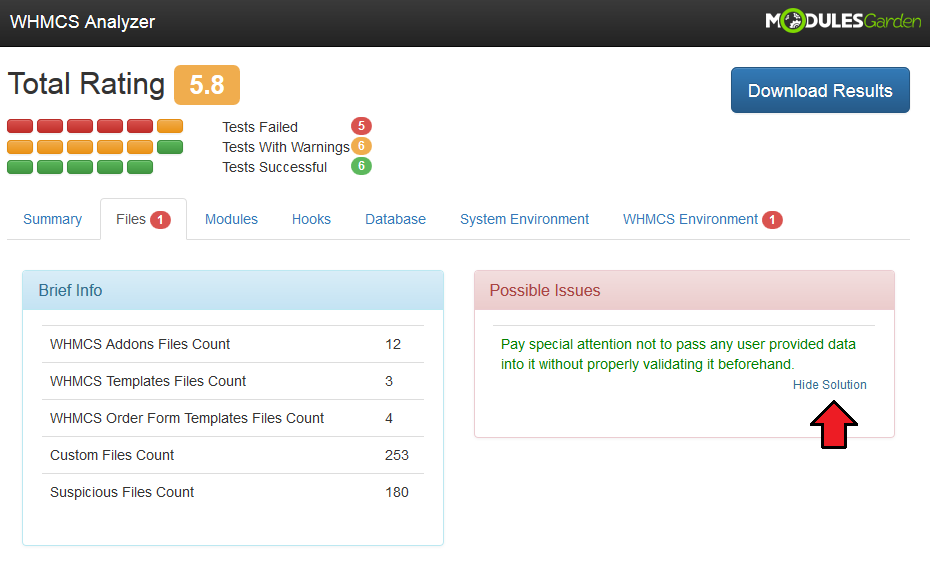
| In some cases we try to suggest the best action to prevent or solve the issue. Press 'Possible Solution' to see it, 'Hide Solution' if you are already familiar with it.
|
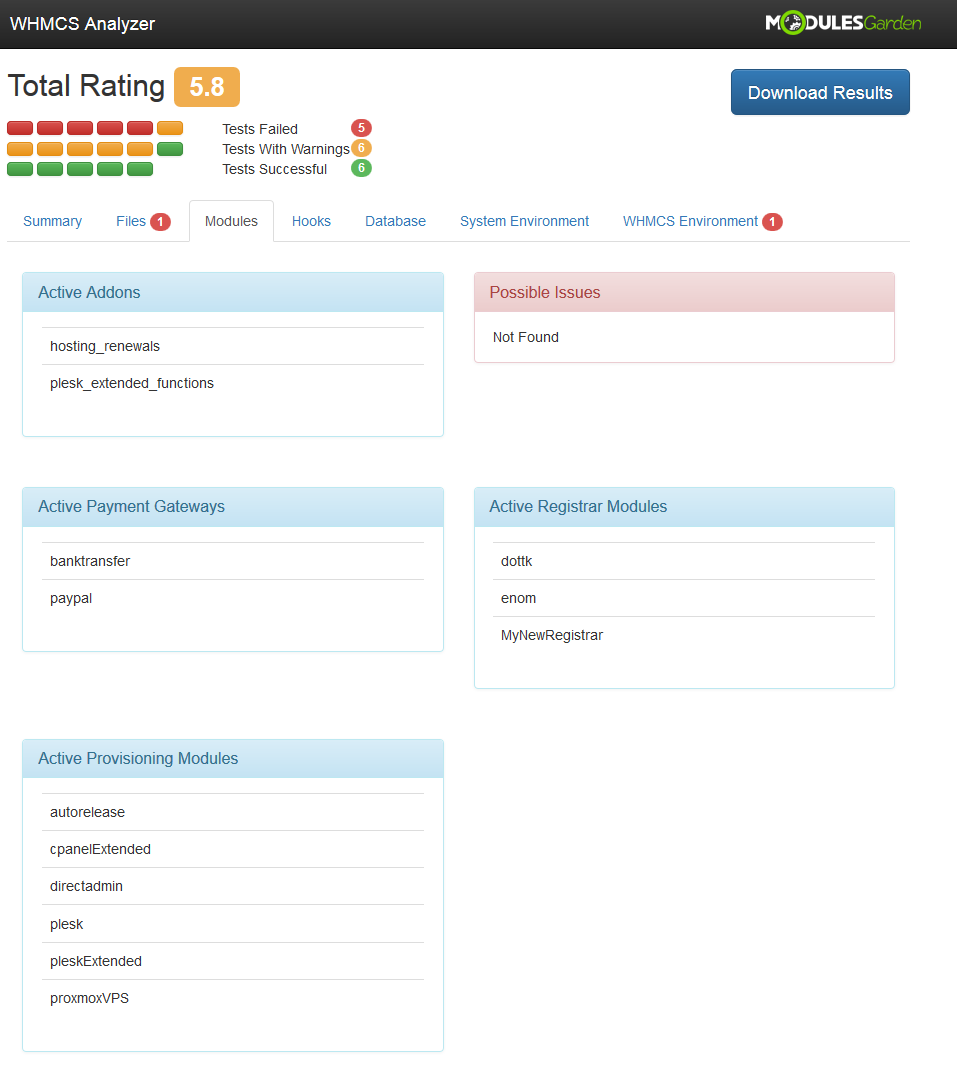
Modules
This section is very short but clear. There is a list of all active addons, payment gateways, registrar and provisioning modules.
Again, possible issues if such exist.
|
Hooks
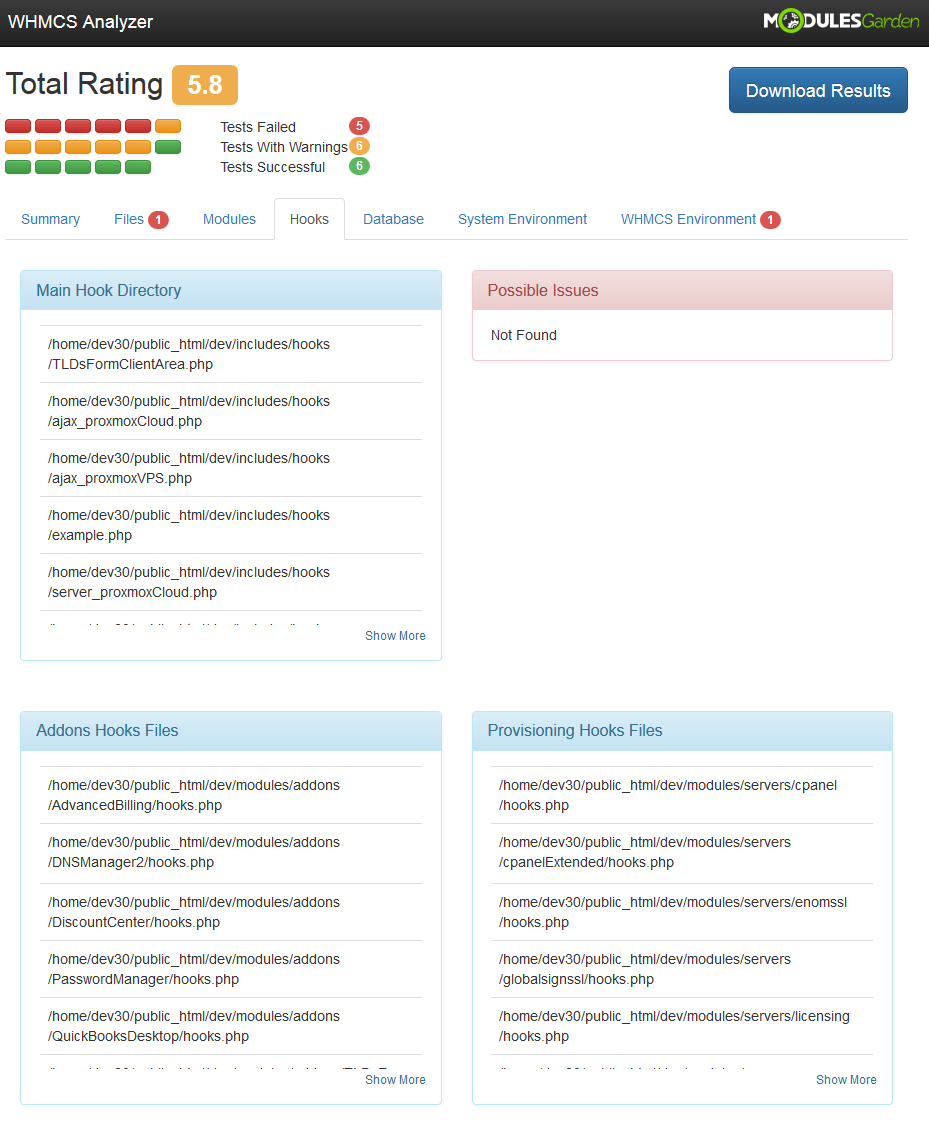
| See details of 'Main Hook Directory', 'Addons Hooks Files' and 'Provisioning Hooks Files'.
|
Database
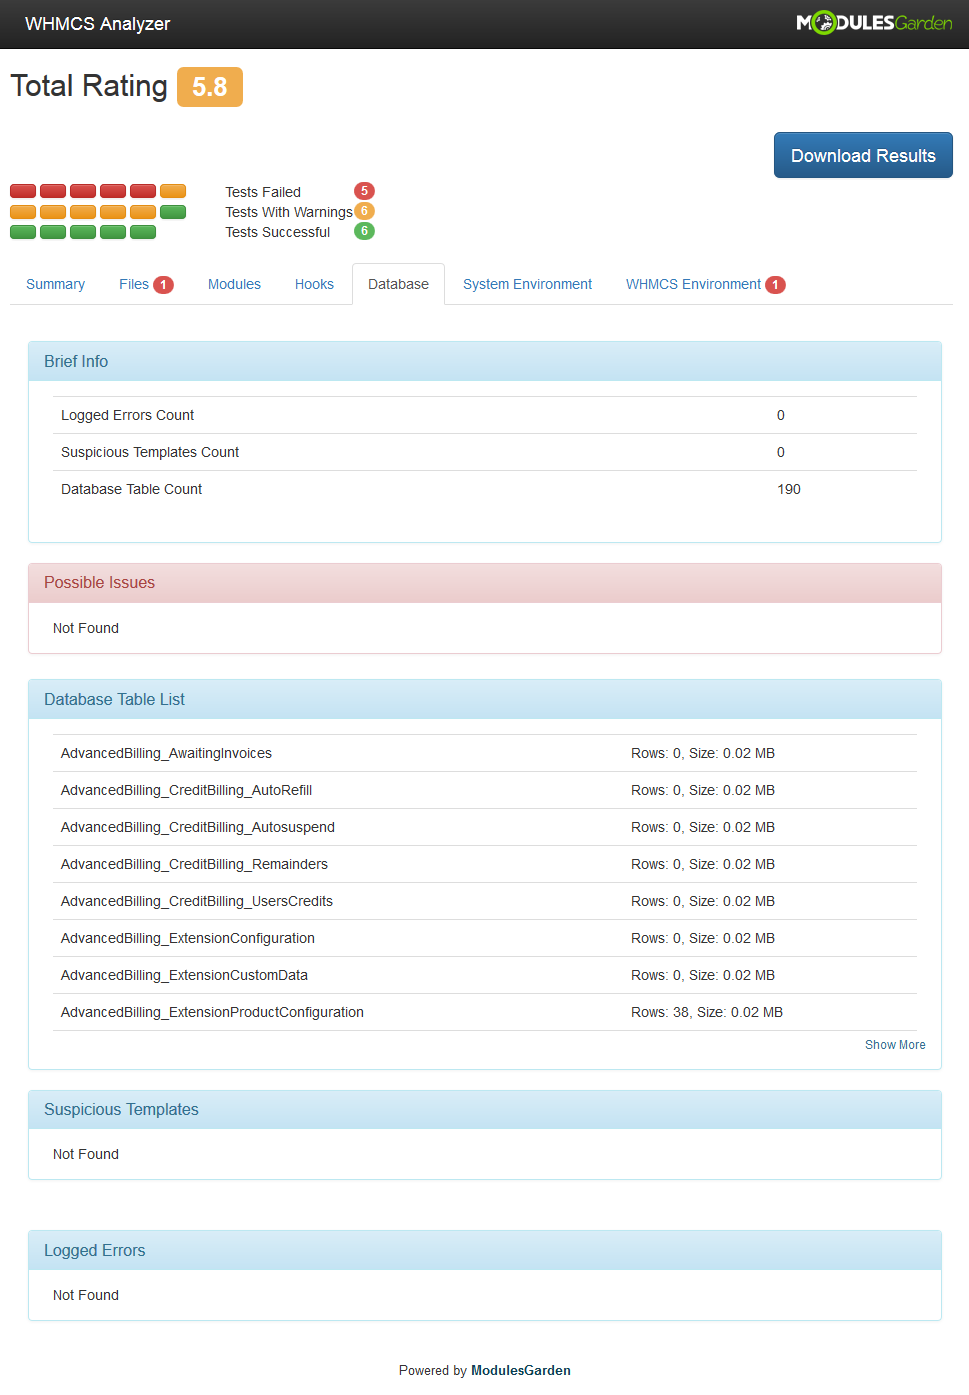
In this section a complete analysis of the following WHMCS database aspects is available:
- Database Table List
- Suspicious Templates
- Logged Errors
Additionally, there is again a 'Brief Info' and 'Possible Issues' sections with suggested solutions.
|
System Environment
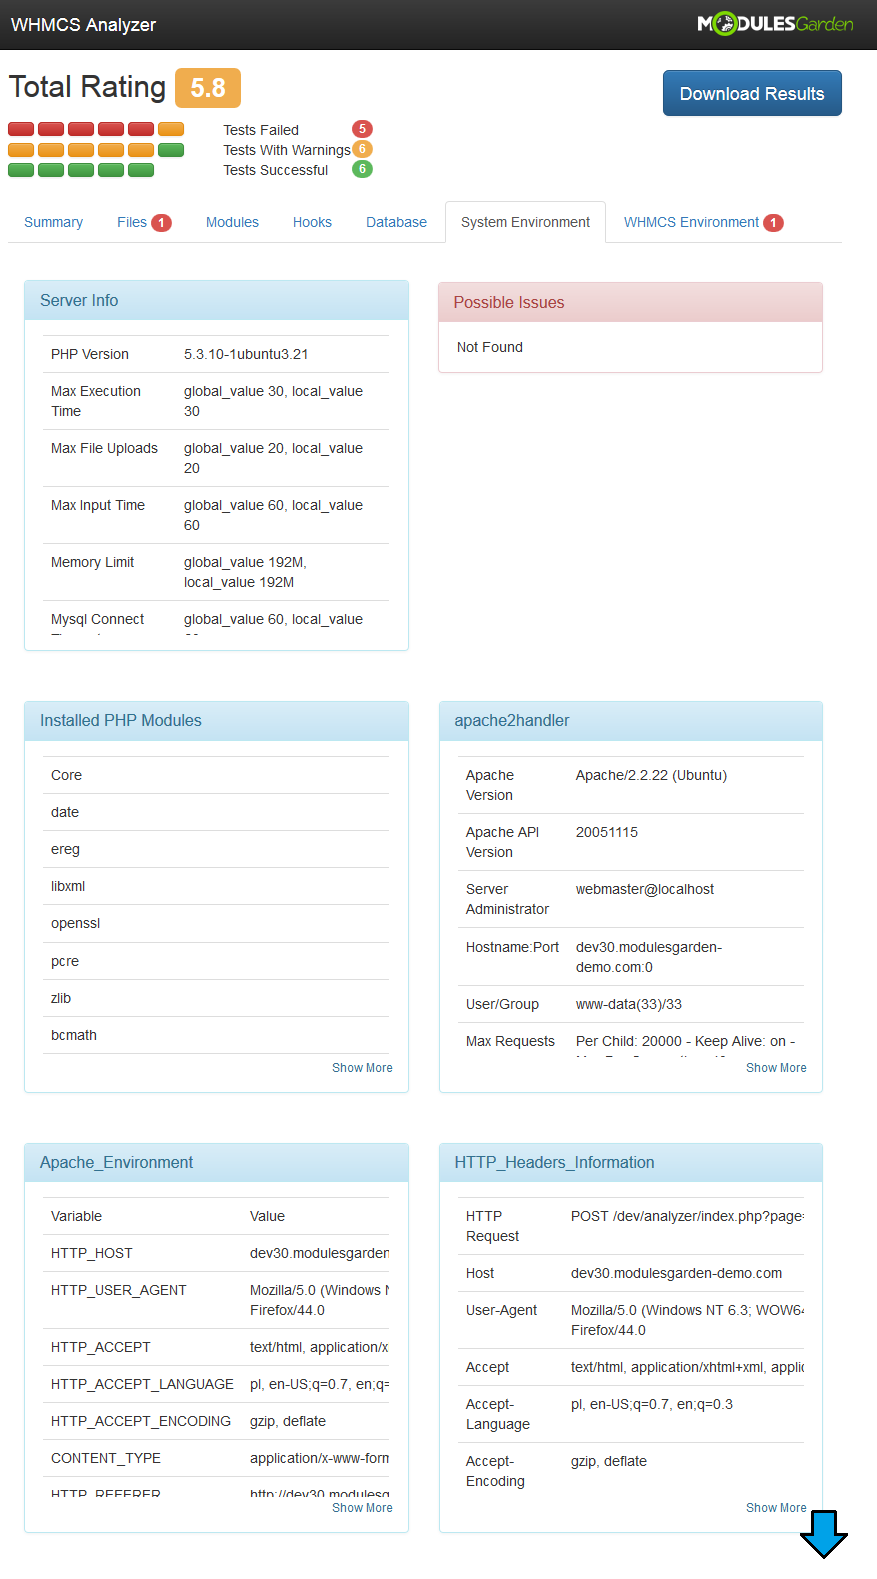
Under this section you will find information on your system in general. These can be data on:
Please note that the below, these are only examples, results will depend on your system customization.
|
- Server Info
- Installed PHP Modules
- apache2handler
- Apache_Environment
- HTTP_Headers_Information
- bcmath
- bz2
- calendar
- Core
- ctype
- curl
- date
- dba
- dom
- ereg
- exif
- fileinfo
- filter
- ftp
- gd
- gettext
- hash
- iconv
|
- imap
- json
- libxml
- mbstring
- mcrypt
- mhash
- mongo
- mysql
- mysqli
- OAuth
- openssl
- pcre
- PDO
- pdo_mysql
- pdo_pgsql
- pgsql
- Phar
- posix
- pspell
- radius
- Reflection
- rrd
- runkit
|
- session
- shmop
- SimpleXML
- snmp
- soap
- sockets
- SPL
- ssh2
- standard
- svn
- sysvmsg
- tokenizer
- wddx
- xml
- xmlreader
- xmlrpc
- xmlwriter
- zip
- zlib
- Environment
- PHP_Variables
- PHP Init
- Possible Issues
|
WHMCS Environment
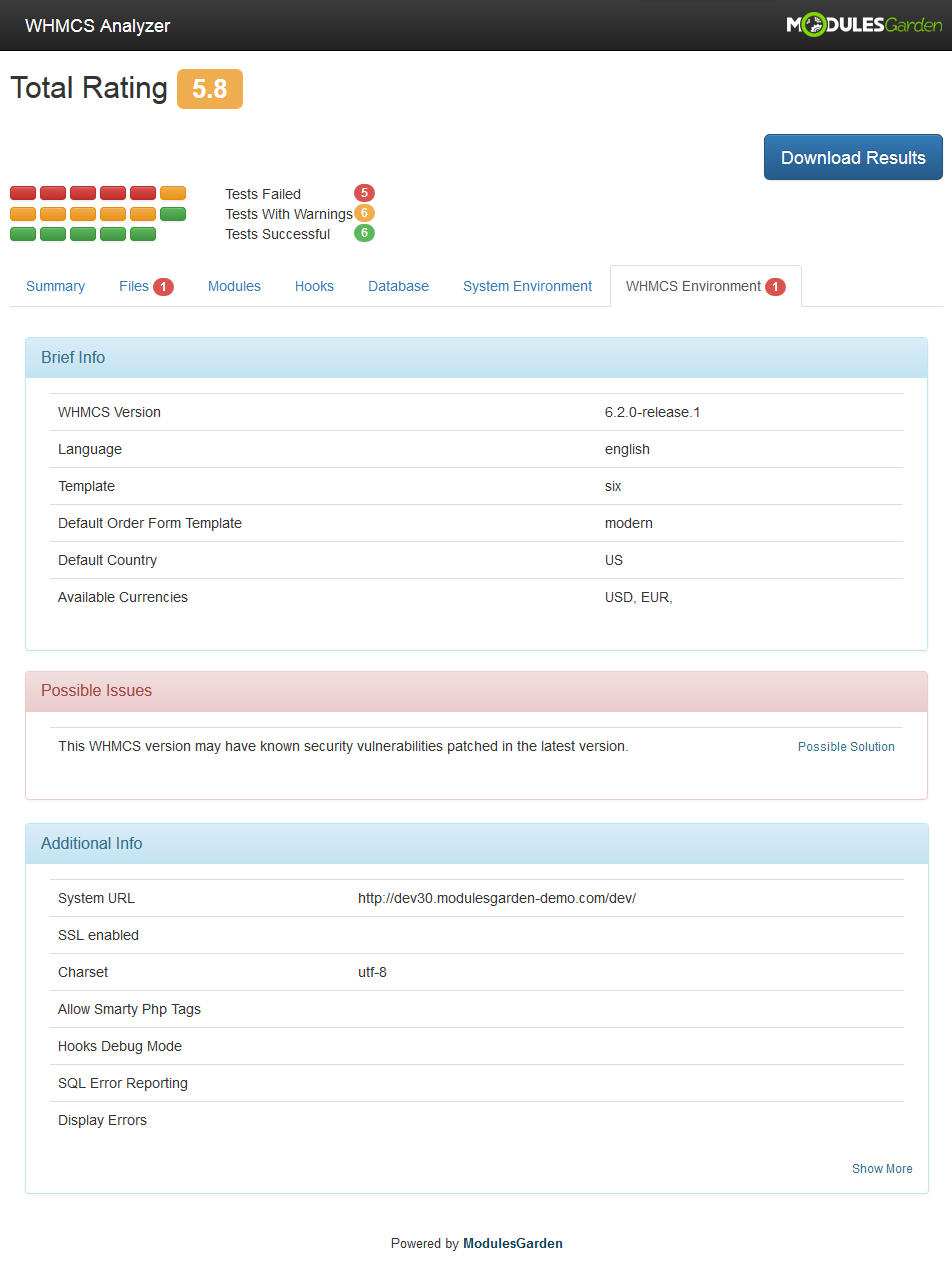
| Last but not least section is simple yet very clear. Your 'WHMCS Environment' includes 'Brief Info' and 'Additional Info' boxes and a list of possible issues.
|
Download File
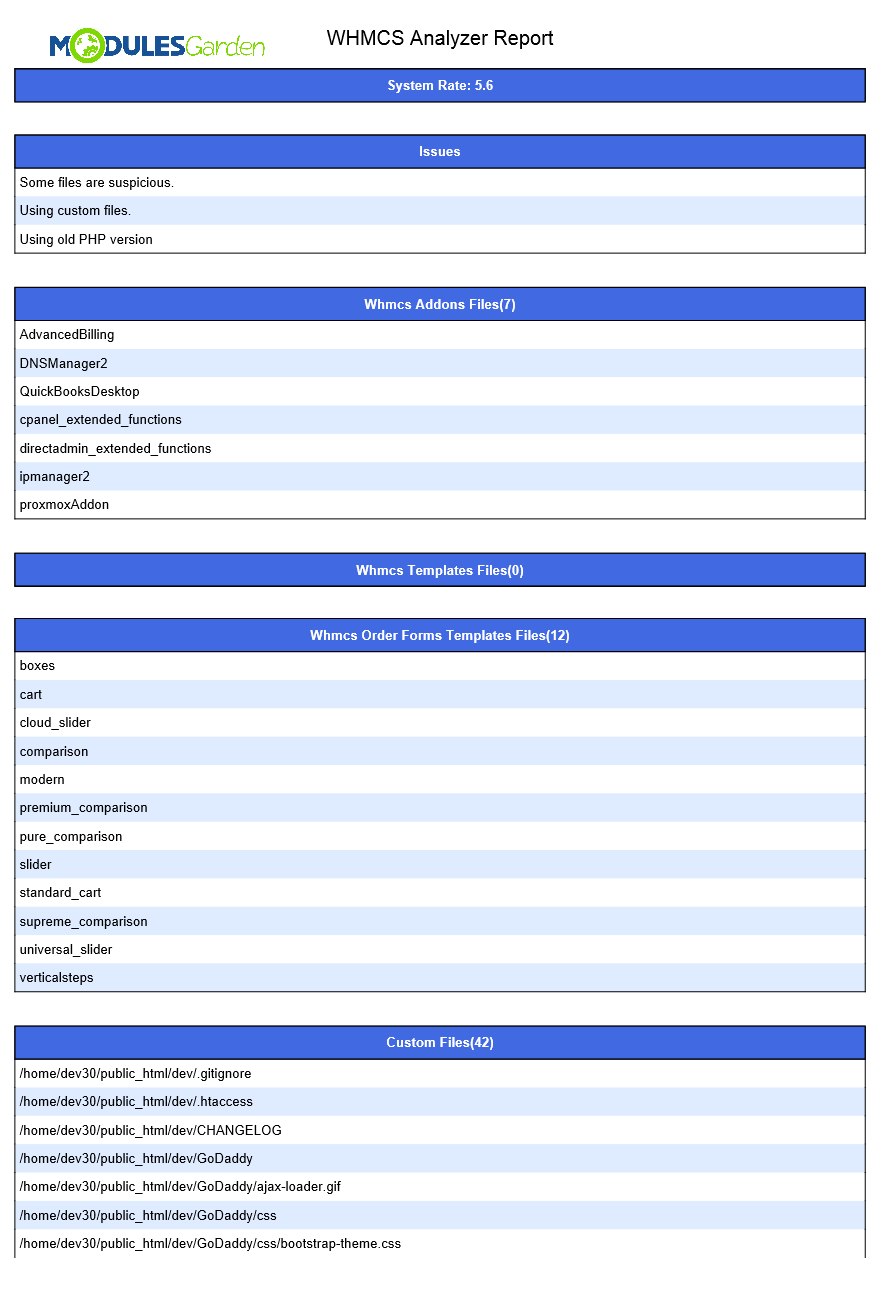
| If you want to save your scan results you may download the current analysis. Press 'Download Results' button to save the results in a ' .PDF' file.
|
| If you decide to save the results after each scan, it will be possible to easily compare them and see any changes in your system.
|
Tips
| 1. Due to a huge size of 'System Environment' section, we advise to use 'Ctrl+F' keys shortage to look for precise information.
|
Common Problems
| 1. When you have problems with connection, check whether your SELinux or firewall does not block ports.
|
| 2. In case you encounter an error like on the screen below, please make sure you have completed step three of our installation instruction.
|
